
Statistics: The Art and Science of Learning from Data (4th Edition)
4th Edition
ISBN: 9780321997838
Author: Alan Agresti, Christine A. Franklin, Bernhard Klingenberg
Publisher: PEARSON
expand_more
expand_more
format_list_bulleted
Videos
Textbook Question
Chapter 9.3, Problem 36PB
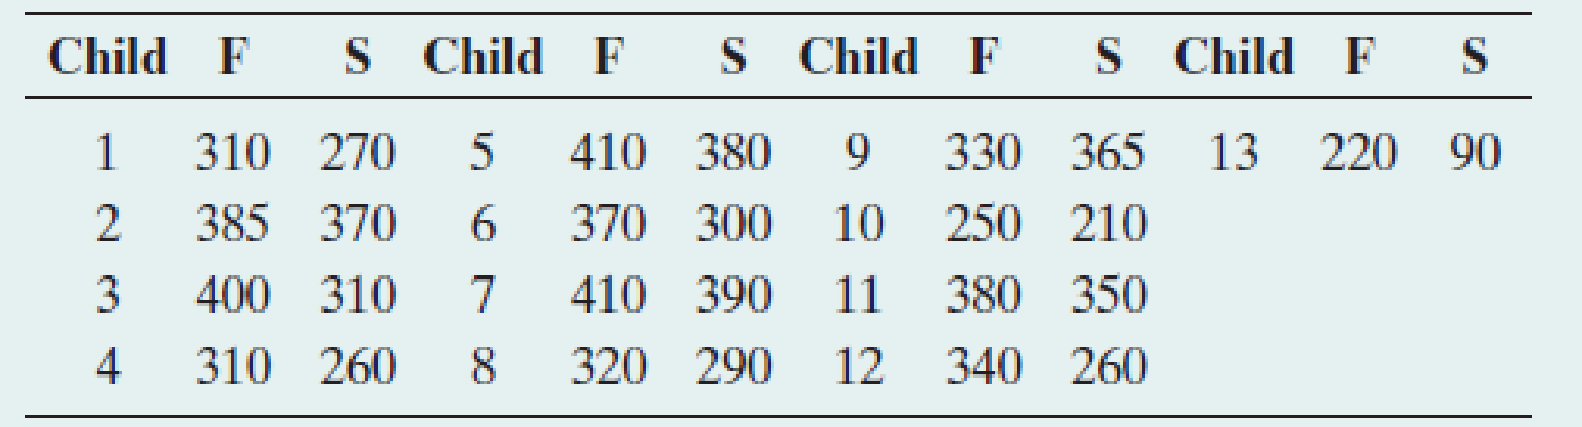
Crossover study A crossover study of 13 children suffering from asthma (Clinical and Experimental Allergy, vol. 20, pp. 429–432, 1990) compared single inhaled doses of formo-terol (F) and salbutamol (S). The outcome measured was the child’s peak expiratory flow (PEF) 8 hours following treatment. The data on PEF follow:
Let µ denote the population
- a. Form the 13 difference scores, for instance 310 − 270 = 40 for child 1 and 330 − 365 = −35 for child 9, always taking F − S. Construct a dot plot or a box plot. Describe the sample data distribution.
- b. Carry out the five steps of the significance test for a mean of the difference scores, using H0: µ = 0 and Ha: µ ≠ 0.
- c. Discuss whether the assumptions seem valid for this example. What is the impact of using a convenience sample?
Expert Solution & Answer
Want to see the full answer?
Check out a sample textbook solution
Students have asked these similar questions
Winter visitors are extremely important to the economy of Southwest Florida. Hotel occupancy is an often-
reported measure of visitor volume and visitor activity. Hotel occupancy data for February in two
consecutive years are as follows.
Current Year
Previous Year
Оссирied Rexms
1470
1458
Total Rooms
1750
1800
a.
Formulate the hypothesis test that can be used to determine if there has been an increase in the
proportion of rooms occupied over the one-year period.
b. What is the estimated proportion of hotel rooms occupied each year?
Using a 0.05 level of significance, what is your hypothesis test conclusion? What is the p-value?
C.
d. What is the 95% confidence interval estimate of the change in occupancy for the one-year period?
Five students provided data regarding the number of hours they spent on studying (TimeStudy) and their GPA. The data are as follows. Answer the following questions.
TimeStudy
GPA
Student 1
2.00
3.50
Student 2
4.00
3.70
Student 3
5.00
3.30
Student 4
3.00
2.60
Student 5
4.00
3.40
Where SS(residual)=∑i(yi−yˆi)^2 is 0.6829
Calculate (by hand) the SStotal and SSmodel.
What does mean by “goodness of fit”?
What is the F-ratio for testing the “goodness of fit”? Is it statistically significant? Calculate this question by hand.
What does tobs = 3.47 mean? What does tcrit = 3.47 mean?
If the ƞ2 in an experiment is 0.6, give any possible value of ω2.
High blood pressure is a known risk factor for heart attack. A research team investigating
ways of reducing the incidence of heart attack in patients attending a large outpatients
clinic are interested in relating the systolic blood pressure (Y) to age in years (X₁) and
weight in kilograms (X₂). A random sample of 10 patients attending the clinic were
measured on each of these three variables. The data is tabulated below.
Y 132 143 153 162 168 137 149 159 128 166
X₁
54 61 65 46 72
52 59 67 73 74
X₂ 78 83 87 95 99 85 85 93 75
98
(a) State an appropriate multiple regression model for the data. Specify all nota-
tion/symbols and assumptions.
(b) Represent the model using matrix and vector notation.
(c) Estimate the values of the parameters of the model.
Chapter 9 Solutions
Statistics: The Art and Science of Learning from Data (4th Edition)
Ch. 9.1 - H0 or Ha? For parts a and b, is the statement a...Ch. 9.1 - H0 or Ha? For each of the following, is the...Ch. 9.1 - Burden of proof For a new pesticide, should the...Ch. 9.1 - Financial aid The average financial aid package...Ch. 9.1 - Low-carbohydrate diet A study plans to have a...Ch. 9.1 - Prob. 6PBCh. 9.1 - Proper hypotheses? Explain what is wrong with each...Ch. 9.1 - Prob. 8PBCh. 9.1 - P-value Indicate whether each of the following...Ch. 9.2 - Psychic A person who claims to be psychic says he...
Ch. 9.2 - Prob. 11PBCh. 9.2 - Get P-value from z For a test of H0: p = 0.50, the...Ch. 9.2 - Get more P-values from z Refer to the previous...Ch. 9.2 - Find test statistic and P-value For a test of H0:...Ch. 9.2 - Dogs and cancer A recent study4 considered whether...Ch. 9.2 - Religion important in your life? Americans ages 18...Ch. 9.2 - Prob. 17PBCh. 9.2 - Prob. 18PBCh. 9.2 - Testing a headache remedy Studies that compare...Ch. 9.2 - Gender bias in selecting managers For a large...Ch. 9.2 - Gender discrimination Refer to the 95% confidence...Ch. 9.2 - Garlic to repel ticks A study (J. Amer. Med....Ch. 9.2 - Exit-poll predictions According to an exit poll of...Ch. 9.2 - Which cola? The 49 students in a class at the...Ch. 9.2 - How to sell a burger A fast-food chain wants to...Ch. 9.2 - A binomial headache A null hypothesis states that...Ch. 9.2 - P-value for small samples Example 4, on whether...Ch. 9.3 - Which t has P-value = 0.05? A t test for a mean...Ch. 9.3 - Practice mechanics of a t test A study has a...Ch. 9.3 - Prob. 30PBCh. 9.3 - Low carbohydrate diet In a recent study,8 272...Ch. 9.3 - Prob. 32PBCh. 9.3 - Facebook friends Many students brag that they have...Ch. 9.3 - Lake pollution An industrial plant claims to...Ch. 9.3 - Weight change for controls A disadvantage of the...Ch. 9.3 - Crossover study A crossover study of 13 children...Ch. 9.3 - Too little or too much wine? Wine-pouring vending...Ch. 9.3 - Prob. 38PBCh. 9.3 - Assumptions important? Refer to the previous...Ch. 9.3 - Anorexia in teenage girls Example 8 described a...Ch. 9.3 - Sensitivity study Ideally, results of a...Ch. 9.3 - Prob. 42PBCh. 9.4 - Dr. Dog In the experiment in Example 4, we got a...Ch. 9.4 - Error probability A significance test about a...Ch. 9.4 - Fracking errors Example 6, in testing H0: p = 0.5...Ch. 9.4 - Prob. 46PBCh. 9.4 - Anorexia decision Refer to the previous exercise....Ch. 9.4 - Prob. 48PBCh. 9.4 - Errors in medicine Consider the test of H0: The...Ch. 9.4 - Prob. 50PBCh. 9.4 - Detecting prostate cancer Refer to the previous...Ch. 9.4 - Prob. 52PBCh. 9.5 - Misleading summaries? Two researchers conduct...Ch. 9.5 - Practical significance A study considers whether...Ch. 9.5 - Prob. 55PBCh. 9.5 - Fishing for significance A marketing study...Ch. 9.5 - Prob. 57PBCh. 9.5 - Prob. 58PBCh. 9.5 - Interpret medical research studies a. An...Ch. 9.6 - Find P(Type II error) A study is designed to test...Ch. 9.6 - Gender bias in selecting managers Exercise 9.20...Ch. 9.6 - Prob. 62PBCh. 9.6 - P(Type II error) large when p close to H0 For...Ch. 9.6 - Prob. 64PBCh. 9.6 - Power for infertility trial Consider Example 13...Ch. 9.6 - Exploring Type II errors Refer to the web app from...Ch. 9 - H0 or Ha? For each of the following hypotheses,...Ch. 9 - Write H0 and Ha For each of the following...Ch. 9 - Prob. 69CPCh. 9 - Free-throw accuracy Consider all cases in which a...Ch. 9 - Brown or Whitman? Californias governor election in...Ch. 9 - Prob. 72CPCh. 9 - Prob. 73CPCh. 9 - Prob. 74CPCh. 9 - Prob. 75CPCh. 9 - Start a hockey team A fraternity at a university...Ch. 9 - Prob. 77CPCh. 9 - Prob. 78CPCh. 9 - Prob. 79CPCh. 9 - Prob. 80CPCh. 9 - Prob. 81CPCh. 9 - Two ideal children? Is the ideal number of...Ch. 9 - Prob. 83CPCh. 9 - Prob. 84CPCh. 9 - Blood pressure When Vincenzo Baranellos blood...Ch. 9 - Increasing blood pressure In the previous...Ch. 9 - Tennis balls in control? When it is operating...Ch. 9 - Prob. 88CPCh. 9 - Prob. 89CPCh. 9 - CI and test Refer to the previous exercise. a. For...Ch. 9 - Prob. 91CPCh. 9 - Religious beliefs statistically significant? A...Ch. 9 - Prob. 93CPCh. 9 - Prob. 94CPCh. 9 - Prob. 95CPCh. 9 - Prob. 96CPCh. 9 - Prob. 98CPCh. 9 - Baseball home team advantage In Major League...Ch. 9 - Prob. 100CPCh. 9 - Prob. 101CPCh. 9 - Prob. 102CPCh. 9 - Prob. 103CPCh. 9 - Prob. 104CPCh. 9 - Prob. 105CPCh. 9 - Prob. 106CPCh. 9 - Prob. 107CPCh. 9 - Prob. 108CPCh. 9 - Significance Explain the difference between...Ch. 9 - More doctors recommend An advertisement by Company...Ch. 9 - Prob. 111CPCh. 9 - Bad P-value interpretations A random sample of...Ch. 9 - Prob. 113CPCh. 9 - Prob. 114CPCh. 9 - Prob. 115CPCh. 9 - Prob. 116CPCh. 9 - Prob. 117CPCh. 9 - Prob. 118CPCh. 9 - Prob. 119CPCh. 9 - Prob. 120CPCh. 9 - Prob. 121CPCh. 9 - True or false A 95% confidence interval for =...Ch. 9 - Prob. 123CPCh. 9 - Prob. 124CPCh. 9 - Prob. 125CPCh. 9 - Prob. 126CPCh. 9 - Prob. 127CPCh. 9 - Prob. 128CP
Knowledge Booster


Learn more about
Need a deep-dive on the concept behind this application? Look no further. Learn more about this topic, statistics and related others by exploring similar questions and additional content below.Similar questions
- High blood pressure is a known risk factor for heart attack. A research team investigating ways of reducing the incidence of heart attack in patients attending a large outpatients clinic are interested in relating the systolic blood pressure (Y) to age in years (X₁) and weight in kilograms (X₂). A random sample of 10 patients attending the clinic were measured on each of these three variables. The data is tabulated below. Y 132 143 153 162 168 137 149 159 128 166 X₁ 52 59 67 73 74 54 61 65 46 72 X₂ 78 83 87 95 99 85 85 93 75 98 (a) State an appropriate multiple regression model for the data. Specify all nota- tion/symbols and assumptions. (b) Represent the model using matrix and vector notation.arrow_forwardSecond-Hand Smoke: Data Set 12 “Passive and Active Smoke” in Appendix B includes cotinine levels measured in a group of nonsmokers exposed to tobacco smoke (n = 40, Mean = 60.58 ng>mL, s = 138.08 ng>mL) and a group of nonsmokers not exposed to tobacco smoke (n = 40, Mean = 16.35 ng>mL, s = 62.53 ng>mL). Cotinine is a metabolite of nicotine, meaning that when nicotine is absorbed by the body, cotinine is produced. Use a 0.05 significance level to test the claim that nonsmokers exposed to tobacco smoke have a higher mean cotinine level than nonsmokers not exposed to tobacco smoke. Construct the confidence interval appropriate for the hypothesis test in part a. What do you conclude about the effects of second-hand smoke?arrow_forwardHigh blood pressure is a known risk factor for heart attack. A research team investigating ways of reducing the incidence of heart attack in patients attending a large outpatients clinic are interested in relating the systolic blood pressure (Y) to age in years (X₁) and weight in kilograms (X₂). A random sample of 10 patients attending the clinic were measured on each of these three variables. The data is tabulated below. Y 132 143 153 162 168 137 149 159 128 166 X₁52 59 67 73 74 54 61 65 46 72 X₂78 83 87 95 99 85 85 93 75 98 (g) Estimate the systolic blood pressure for a 70 year old patient who weighs 85 kg. (h) Find a 95% prediction interval for the systolic blood pressure of a patient who is 70 years old and weighs 85 kg.arrow_forward
- a. Compute the correlation coefficient between radiation dose and exposure time.arrow_forwardCardiovascular Disease Suppose the incidence rate of myocardial infarction (MI) was 5 per 1000 among 45- to 54-year-old men in 2000. To look at changes in incidence over time, 5000 men in this age group were followed for 1 year starting in 2010. Fifteen new cases of MI were found. Suppose that 25% of patients with Mi in 2000 died within 24 hours. This propartion is called the 24-hour case-fatality rate. Of the 15 new MI cases in the preceding study. 5 died within 24 hours. Test whether the 24-hour case- fatality rate changed from 2000 to 2010.arrow_forwardData consistent with summary quantities in the article "Effects of Fast-Food Consumption on Energy Intake and Diet Quality Among Children" on total calorie consumption on a particular day are given for a sample of children who did not eat fast food on that day and for a sample of children who did eat fast food on that day. Assume that it is reasonable to regard these samples as representative of the population of children in the United States. No Fast Food 2323 1910 1001 1722 1461 2045 2135 1973 1844 1769 1757 1819 1640 1498 2661 Fast Food 2543 1778 954 2348 2454 2287 2546 1215 910 1531 895 2227 1831 1270 2137 (a) Use the given information to estimate the mean calorie intake for children in the United States on a day when no fast food is consumed. (Give the answer to one decimal place.) 1788.4 1x 0 (b) Use the given information to estimate the mean calorie intake for children in the United States on a day when fast food consumed. (Give the answer to one decimal place.) x (c) Use the…arrow_forward
- Are seatbelts effective at saving lives? We wish to examine whether or not the use of seatbelts reduces fatalities at the a = 0.01 level of significance. Let pN represent the proportion of non-seatbelt wearing passengers who were involved in a crash and died and py represent the proportion of seatbelt wearing passengers who were involved in a crash and died. NOTE: The data used in this study were obtained through observational study...no experiment was conducted! Which would be correct hypotheses for this test? O Ho:PN = pY, H1:PN > pY Ho: PN = pY, H,:PN Py In a random sample of 321 non-seatbelt wearing passengers involved in a car crash, 30 were killed. In a random sample of 492 seatbelt wearing passengers involved in a car crash, 13 were killed. Find the test statistic (2 decimal places): Give the P-value (4 decimal places - if less than 0.001 answer 0): Which is the correct result: Reject the Null Hypothesis O Do not Reject the Null Hypothesis Which would be the appropriate…arrow_forwardAn article in Plant Disease, "Effect of Nitrogen and Potassium Fertilizer Rates on Severity of Xanthomonas Blight of Syngonium Podophyllum" (1989, Vol. 73, No. 12, pp. 972-975) showed the effect of the variable nitrogen and potassium rates on the growth of "White Butterfly" and the mean percentage of disease. Data representative of that collected in this experiment is provided in the following table. Potassium (mg/pot/wk) Nitrogen (mg/pot/wk) 30 90 120 50 60.8 60.8 45.5 43.0 60.0 58.4 150 54.4 56.1 53.8 51.6 34.5 35.5 250 42.9 40.0 36.1 37.9 33.0 33.3 (a) Use the analysis of variance to test the appropriate hypotheses with a = 0.05. The effect of the variable nitrogen significant, the effect of the potassium rates significant, the interaction between the variable nitrogen and potassium rates significant. (b) Graphically analyze the residuals from this experiment. The residuals acceptable. (c) Estimate the appropriate variance component. Round your answers to 2 decimal places. Source…arrow_forwardA random sample of 42 earthquakes that have occurred between January 2015 and September 2017 was selected and for each earthquake the magnitude of the earthquake and the number of people killed was recorded. The data appear in the scatterplot below. 400 350 300 250 200 150 100 50 0 3 -50 4 5 6 7 8 9 10 -100 -150 Magnitude of Earthquake 8 Consider the scatterplot above question 2. Use this scatterplot to describe completely the relationship between the magnitude of the earthquake and the number of people killed. Positive and linear Negative, moderate, linear O Negative, strong, linear Positive, moderate, linear Number of People Killed ---arrow_forward
- “Passive and Active Smoke” in Appendix B includes cotinine levels measured in a group of nonsmokers exposed to tobacco smoke (n = 40, Mean = 60.58 ng>mL, s = 138.08 ng>mL) and a group of nonsmokers not exposed to tobacco smoke (n = 40, Mean = 16.35 ng>mL, s = 62.53 ng>mL). Cotinine is a metabolite of nicotine, meaning that when nicotine is absorbed by the body, cotinine is produced. Use a 0.05 significance level to test the claim that nonsmokers exposed to tobacco smoke have a higher mean cotinine level than nonsmokers not exposed to tobacco smoke. Based on your hypothesis tests and confidence intervals, what do you conclude about the effects of second hand smoke? Why?arrow_forwardIdentify the correlation coefficient r: critical values: round to 3 decimals pleasearrow_forward“Passive and Active Smoke” in Appendix B includes cotinine levels measured in a group of nonsmokers exposed to tobacco smoke (n = 40, Mean = 60.58 ng>mL, s = 138.08 ng>mL) and a group of nonsmokers not exposed to tobacco smoke (n = 40, Mean = 16.35 ng>mL, s = 62.53 ng>mL). Cotinine is a metabolite of nicotine, meaning that when nicotine is absorbed by the body, cotinine is produced. Use a 0.05 significance level to test the claim that nonsmokers exposed to tobacco smoke have a higher mean cotinine level than nonsmokers not exposed to tobacco smoke. 1. Construct a confidence interval estimate of the difference betwen the mean continen levels fo the two groups of nonsmokers. What confidence level would be appropriate? 2. Find the margin of error E using the formula. 3. What is the confidence interval? Explain the meaning of the confidence interal and what the limit represents.arrow_forward
arrow_back_ios
SEE MORE QUESTIONS
arrow_forward_ios
Recommended textbooks for you
 Glencoe Algebra 1, Student Edition, 9780079039897...AlgebraISBN:9780079039897Author:CarterPublisher:McGraw Hill
Glencoe Algebra 1, Student Edition, 9780079039897...
Algebra
ISBN:9780079039897
Author:Carter
Publisher:McGraw Hill
Hypothesis Testing using Confidence Interval Approach; Author: BUM2413 Applied Statistics UMP;https://www.youtube.com/watch?v=Hq1l3e9pLyY;License: Standard YouTube License, CC-BY
Hypothesis Testing - Difference of Two Means - Student's -Distribution & Normal Distribution; Author: The Organic Chemistry Tutor;https://www.youtube.com/watch?v=UcZwyzwWU7o;License: Standard Youtube License