
Videos
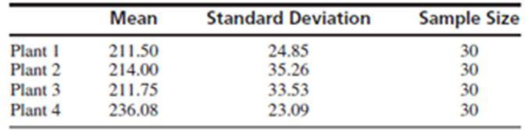
The article “Impact of Free Calcium Oxide Content of Fly Ash on Dust and Sulfur Dioxide Emissions in a Lignite-Fired Power Plant” (D. Sotiropoulos, A. Georgakopoulos, and N. Kolovos, Journal of Air and Waste Management, 2005:1042–1049) presents measurements of dust emissions, in mg/m3, for four power plants. Thirty measurements were taken for each plant. The sample means and standard deviations are presented in the following table:
- a. Construct an ANOVA table. You may give a
range for the P-value. - b. Can you conclude that there are differences among the
mean emission levels?
a.
Construct an ANOVA table and give a range for the P-value.
Answer to Problem 8E
The ANOVA table is,
| Source | DF | SS | MS | F | P |
| Plant | 3 | 12,712.7 | 4,237.6 | 4.8179 | 0.01<P-value<0.001 |
| Error | 116 | 102,027.8 | 879.55 | ||
| Total | 119 | 114,740.5 |
The range of P-value is
Explanation of Solution
Given info:
The data represents the means and standard deviations of 30 measurements of dust emissions taken on four types of plants.
Calculation:
The ANOVA table can be obtained as follows:
There are four samples, therefore
The total number of observations is,
The degrees of freedom corresponding to the plant is obtained as follows:
The degrees of freedom corresponding to the total is obtained as follows:
The degrees of freedom corresponding to the error is obtained as follows:
Total mean can be obtained as follows:
Substitute
The treatment sum of squares (SSTr) is obtained as follows:
Substitute
The error sum of squares (SSE) is obtained as follows:
Substitute
The total sum of squares (SST) is obtained as follows:
Substitute
The treatment mean square is obtained as follows:
Substitute
The error mean square is obtained as follows:
Substitute
The F-value is obtained as follows:
Substitute
Thus, the F-value is 4.8179.
From Appendix A table A.8, the upper 1% point of the
Therefore, the range of P-value is
Thus, the ANOVA table is,
| Source | DF | SS | MS | F | P |
| Plant | 3 | 12,712.7 | 4,237.6 | 4.8179 | 0.01<P-value<0.001 |
| Error | 116 | 102,027.8 | 879.55 | ||
| Total | 119 | 114,740.5 |
b.
Check whether the mean emission levels differ for four types of plants.
Answer to Problem 8E
There is sufficient evidence to conclude that the mean emission levels differ for four types of plants.
Explanation of Solution
Calculation:
State the hypotheses:
Null hypothesis:
Alternative hypothesis:
From part (a), the F-ratio is 4.8179.
P-value:
From part (a), the P-value is between 0.01 and 0.001.
Since, the level of significance is not specified; the prior level of significance
Decision:
If
If
Conclusion:
Here, the P-value is less than the level of significance.
That is,
By rejection rule, reject the null hypothesis.
There is sufficient evidence to conclude that the mean emission levels differ for four types of plants at
Want to see more full solutions like this?
Chapter 9 Solutions
Statistics for Engineers and Scientists (Looseleaf)
Additional Math Textbook Solutions
Basic Business Statistics, Student Value Edition (13th Edition)
Elementary Statistics (13th Edition)
Introductory Statistics
Statistics for Business and Economics (13th Edition)
Applied Statistics in Business and Economics


- In the article “Occurrence and Distribution of Ammonium in Iowa Groundwater” (K.Schilling, Water Environment Research, 2002:177–186), ammonium concentrations (inmg/L) were measured at a total of 349 alluvial wells in the state of Iowa. The mean concentration was 0.27, the median was 0.10, and the standard deviation was 0.40. If a histogram of these 349 measurements were drawn,a) it would be most likely skewed to the right.b) it would be most likely skewed to the left.c) it would be approximately symmetric.d) its shape could not be determined without knowing the relative frequencies.arrow_forwardThe article "Impact of Free Calcium Oxide Content of Fly Ash on Dust and Sulfur Dioxide Emissions in a Lignite-Fired Power Plant" (D. Sotiropoulos, A. Georgakopoulos, and N. Kolovos, Journal of Air and Waste Management, 2005:1042-1049) presents measurements of dust emissions, in mg/m?, for four power plants. Thirty measurements were taken for each plant. The sample means and standard deviations are presented in the following table: Mean Standard Deviation Sample Size Plant 1 211.50 24.85 30 Plant 2 214.00 35.26 30 Plant 3 211.75 33.53 30 Plant 4 236.08 23.09 30 Construct an ANOVA table. You may give a range for the P-value. Can you conclude that there are differences among the mean emission levels? a. b.arrow_forwardThe authors of the paper "Statistical Methods for Assessing Agreement Between Two Methods of Clinical Measurement"† compared two different instruments for measuring a person's ability to breathe out air. (This measurement is helpful in diagnosing various lung disorders.) The two instruments considered were a Wright peak flow meter and a mini-Wright peak flow meter. Seventeen people participated in the study, and for each person air flow was measured once using the Wright meter and once using the mini-Wright meter. Subject Mini-WrightMeter WrightMeter Subject Mini-WrightMeter WrightMeter 1 512 494 10 445 433 2 430 395 11 432 417 3 520 516 12 626 656 4 428 434 13 260 267 5 500 476 14 477 478 6 600 557 15 259 178 7 364 413 16 350 423 8 380 442 17 451 427 9 658 650 (a) Suppose that the Wright meter is considered to provide a better measure of air flow, but the mini-Wright meter is easier to transport and to use. If the two types of meters produce different…arrow_forward
- The authors of the paper "Statistical Methods for Assessing Agreement Between Two Methods of Clinical Measurement"† compared two different instruments for measuring a person's ability to breathe out air. (This measurement is helpful in diagnosing various lung disorders.) The two instruments considered were a Wright peak flow meter and a mini-Wright peak flow meter. Seventeen people participated in the study, and for each person air flow was measured once using the Wright meter and once using the mini-Wright meter. Subject Mini-WrightMeter WrightMeter Subject Mini-WrightMeter WrightMeter 1 512 494 10 445 433 2 430 395 11 432 417 3 520 516 12 626 656 4 428 434 13 260 267 5 500 476 14 477 478 6 600 557 15 259 178 7 364 413 16 350 423 8 380 442 17 451 427 9 658 650 (a) Suppose that the Wright meter is considered to provide a better measure of air flow, but the mini-Wright meter is easier to transport and to use. If the two types of meters produce…arrow_forwardThe yield of alfalfa from a random sample of six test plots is 1.4, 1.6, 0.9, 1.9, 2.2,and 1.2 tons per acre. Assume the data can be looked upon as a sample from anormal population. Test at the 0.05 level of significance whether this supports thecontention that the average yield for this kind of alfalfa is 1.5 tones per acre.arrow_forwardwidely used as dielectrics and coolants in electrical systems in the past. They were found to be a major environmental contaminant in the 1960s. In a study, the mean PCB content at each of thirteen sites was reported for the years 1982 and 1996 (from “The ratio of DDE to PCB concentrations in Great Lakes herring gull eggs and its use in interpreting contaminants data”, Journal of Great Lakes Research 24 (1): 12-31, 1998). The data are below.Site:12345678910111213198261.4864.4745.5059.7058.8175.9671.5738.0630.5139.7029.7866.8963.93199613.9918.2611.2810.0221.0017.3628.207.3012.809.4112.6316.8322.74(a) Which test would be more appropriate in this case: a t-test for the difference between two population means, or a paired t-test? Why?(b) Do the data provide sufficient evidence to support the claim that the mean PCB level has decreased in the region? Be sure to check all assumptions, write the null and alternative hypotheses, calculate the appropriate test statistic, calculate the p-value,…arrow_forward
- The article "Solid-Phase Chemical Fractionation of Selected Trace Metals in Some Northern Kentucky Soils" (A. Karathanasis and J. Pils, Soil and Sediment Contamination, 2005:293-308) presents pH measurements of soil specimens taken from three" different types of soils. The results in the following table are consistent with" means and standard deviations reported in the article. Soil Type pH Measurements Alluvium 6.53, 6.03, 6.75, 6.82, 6.24 Glacial 6.07, 6.07, 5.36, 5.57, 5.48, 5.27, 5.80, 5.03, 6.65 Till Residuum 6.03, 6.16, 6.63, 6.13, 6.05, 5.68, 6.25, 5.43, 6.46, 6.91, 5.75, 6.53 Construct an ANOVA table. You may give a range for the P-value. Can you conclude that there are differences among the mean pH levels? a. b.arrow_forwardThe authors of the paper "Statistical Methods for Assessing Agreement Between Two Methods of Clinical Measurement" compared two different instruments for measuring a subject's ability to breathe out air.† (This measurement is helpful in diagnosing various lung disorders.) The two instruments considered were a Wright peak flow meter and a mini-Wright peak flow meter. Seventeen subjects participated in the study, and for each subject air flow was measured once using the Wright meter and once using the mini-Wright meter. Subject 1 2 3 4 5 6 7 8 9 Mini- Wright Meter 512 430 520 428 500 600 364 380 658 Wright Meter + 494 395 516 434 476 557 413 442 650 Subject 10 11 12 13 14 15 16 17 Mini- Wright Meter 445 432 626 260 477 259 350 451 Wright Meter 433 417 656 267 478 178 423 427 (a) Suppose that the Wright meter is considered to provide a better measure of air flow, but the mini-Wright meter is easier to transport and to use. If the two types of meters produce different readings but there is…arrow_forwardThe authors of the paper "Statistical Methods for Assessing Agreement Between Two Methods of Clinical Measurement" compared two different instruments for measuring a subject's ability to breathe out air.† (This measurement is helpful in diagnosing various lung disorders.) The two instruments considered were a Wright peak flow meter and a mini-Wright peak flow meter. Seventeen subjects participated in the study, and for each subject air flow was measured once using the Wright meter and once using the mini-Wright meter. Subject Mini-WrightMeter WrightMeter Subject Mini-WrightMeter WrightMeter 1 512 494 10 445 433 2 430 395 11 432 417 3 520 516 12 626 656 4 428 434 13 260 267 5 500 476 14 477 478 6 600 557 15 259 178 7 364 413 16 350 423 8 380 442 17 451 427 9 658 650 (a) Suppose that the Wright meter is considered to provide a better measure of air flow, but the mini-Wright meter is easier to transport and to use. If the two types of meters produce…arrow_forward
- The authors of the paper "Statistical Methods for Assessing Agreement Between Two Methods of Clinical Measurement" compared two different instruments for measuring a subject's ability to breathe out air.† (This measurement is helpful in diagnosing various lung disorders.) The two instruments considered were a Wright peak flow meter and a mini-Wright peak flow meter. Seventeen subjects participated in the study, and for each subject air flow was measured once using the Wright meter and once using the mini-Wright meter. Subject Mini-WrightMeter WrightMeter Subject Mini-WrightMeter WrightMeter 1 512 494 10 445 433 2 430 395 11 432 417 3 520 516 12 626 656 4 428 434 13 260 267 5 500 476 14 477 478 6 600 557 15 259 178 7 364 413 16 350 423 8 380 442 17 451 427 9 658 650 (a) Suppose that the Wright meter is considered to provide a better measure of air flow, but the mini-Wright meter is easier to transport and to use. If the two types of meters produce different readings but there is a…arrow_forwardThe sulphur dioxide concentration (in percent) of gases collected from the eruptions of two volcanoes was measured. At each volcano, thirty measurements were taken. The following is the data set. Question: Accept or reject the null hypothesis that there is no difference in sulphur dioxide content in the composition of gases in two eruptions at the 0.05 level of significance? Draw your normal curve for supportarrow_forwardThe mean output of solar cells of three types is measured six times under random light intensity over a period of 5 minutes, yielding the results shown. Research question: Is the mean solar cell output the same for all cell types?arrow_forward
 Glencoe Algebra 1, Student Edition, 9780079039897...AlgebraISBN:9780079039897Author:CarterPublisher:McGraw Hill