
Essentials of Statistics (6th Edition)
6th Edition
ISBN: 9780134685779
Author: Mario F. Triola
Publisher: PEARSON
expand_more
expand_more
format_list_bulleted
Videos
Textbook Question
Chapter 9, Problem 8CQQ
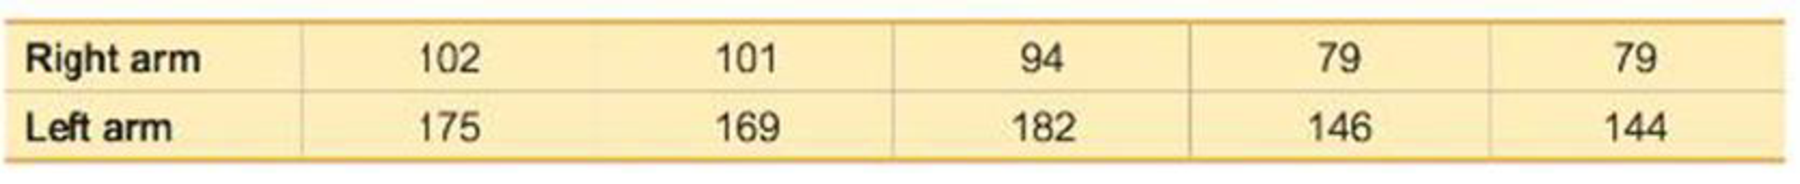
Dependent or Independent? Listed below are systolic blood pressure measurements (mm Hg) taken from the right and left arms of the same woman at different times (based on data from “Consistency of Blood Pressure Differences Between the Left and Right Arms,” by Eguchi et al., Archives of Internal Medicine, Vol. 167). Are the data dependent or independent?
Expert Solution & Answer
Want to see the full answer?
Check out a sample textbook solution
Students have asked these similar questions
Ankle Brachial Index. The ankle brachial index (ABI) compares the blood pressure of a patient’s arm to the blood pressure of the patient’s leg. The ABI can be an indicator of different diseases, including arterial diseases. A healthy (or normal) ABI is 0.9 or greater. In a study by M. McDermott et al. titled “Sex Differences in Peripheral Arterial Disease: Leg Symptoms and Physical Functioning” (Journal of the American Geriatrics Society, Vol. 51, No. 2, pp. 222–228), the researchers obtained the ABI of 187 women with peripheral arterial disease. The results were a mean ABI of 0.64 with a standard deviation of 0.15. At the 1% significance level, do the data provide sufficient evidence to conclude that, on average, women with peripheral arterial disease have an unhealthy ABI?
Ost watched Ani...
Question 2
Y Part 1 of 4
A doctor in Cleveland wants to know whether the average life span for heart disease patients at four
hospitals in the city differ. The data below represents the life span, in years, of heart disease
patients from each hospital. Perform an ANOVA test with a 9% level of significance to test whether
the average life span of heart disease patients in Cleveland differs depending on the hospital that
treats them
Life Span of Patients Treated at Hospital 1:
7.4, 7.8, 7.7, 7.5, 8, 8.2, 7.8, 8.6, 8, 7.8, 8.3, 8.3, 8, 7.6, 8.2, 7.9, 7.3, 8, 8.6, 7.3, 8.3, 8, 7.8, 8, 7.8, 8.1,
8.1, 8, 7.6, 7.6, 7.7, 7.4, 7.7, 7.8, 7.8
Life Span of Patients Treated at Hospital 2:
7.9, 7.9, 8.2, 8, 8.1, 8.5, 8.3, 8.4, 8, 8.2, 7.7, 8, 8, 7.8, 7.9, 8.1, 8.1, 7.8, 7.9, 8, 8.5, 8.3, 8.2, 8.3, 7.8, 7.9
Life Span of Patients Treated at Hospital 3:
8.2, 8.1, 7.4, 8.7, 8.6, 8.2, 7.9, 8.1, 8.1, 8.3, 8.3, 8, 7.6, 8, 7.4, 8.6, 8.2, 8.2, 7.9, 7.7, 8.1, 7.9, 8, 8.3
Life Span of…
Retinitis pigmentosa (RP) is a hereditary ocular diseasein which patches of pigment appear on the retina, potentially resulting in substantial vision loss and in somecases complete blindness. An important issue is how fastthe subjects decline. Visual field is an important measureof area of vision, which is measured in degree2. A visualfield area for a normal person is around 11,000 degree2.The longitudinal data in Table 11.29 were provided by anindividual patient.Table 11.29 Longitudinal visual field data forone RP patientTime Visual field area lnVisit (yr) (degree2) (visual field area)1 0 3059 8.032 1 3053 8.023 2 1418 7.264 3 1692 7.435 4 1978 7.596 5 1567 7.367 6 1919 7.568 7 1998 7.609 11 1648 7.4110 13 1721 7.4511 15 1264 7.14mean 6.09 1938 7.532sd 4.97 597 0.280Suppose the rate of change of ln (visual field) is a linearfunction of follow-up time.11.103 Write down a linear regression model that summarizes this relationship.
Chapter 9 Solutions
Essentials of Statistics (6th Edition)
Ch. 9.1 - Verifying Requirements In the largest clinical...Ch. 9.1 - Verifying Requirements In the largest clinical...Ch. 9.1 - Hypotheses and Conclusions Refer to the hypothesis...Ch. 9.1 - Using Confidence Intervals a. Assume that we want...Ch. 9.1 - Interpreting Displays. In Exercises 5 and 6, use...Ch. 9.1 - Treating Carpal Tunnel Syndrome Carpal tunnel...Ch. 9.1 - Testing Claims About Proportions. In Exercises...Ch. 9.1 - Accuracy of Fast Food Drive-Through Orders In a...Ch. 9.1 - Testing Claims About Proportions. In Exercises...Ch. 9.1 - Testing Claims About Proportions. In Exercises...
Ch. 9.1 - Testing Claims About Proportions. In Exercises...Ch. 9.1 - Testing Claims About Proportions. In Exercises...Ch. 9.1 - Testing Claims About Proportions. In Exercises...Ch. 9.1 - Testing Claims About Proportions. In Exercises...Ch. 9.1 - Testing Claims About Proportions. In Exercises...Ch. 9.1 - Prob. 16BSCCh. 9.1 - Testing Claims About Proportions. In Exercises...Ch. 9.1 - Testing Claims About Proportions. In Exercises...Ch. 9.1 - Testing Claims About Proportions. In Exercises...Ch. 9.1 - Testing Claims About Proportions. In Exercises...Ch. 9.1 - Testing Claims About Proportions. In Exercises...Ch. 9.1 - Testing Claims About Proportions. In Exercises...Ch. 9.1 - Prob. 23BBCh. 9.1 - Yawning and Fishers Exact Test In one segment of...Ch. 9.1 - Overlap of Confidence Intervals In the article On...Ch. 9.1 - Equivalence of Hypothesis Test and Confidence...Ch. 9.2 - Independent and Dependent Samples Which of the...Ch. 9.2 - Confidence Interval for Hemoglobin Large samples...Ch. 9.2 - Hypothesis Tests and Confidence Intervals for...Ch. 9.2 - Degrees of Freedom For Example 1 on page 431, we...Ch. 9.2 - In Exercises 520, assume that the two samples are...Ch. 9.2 - In Exercises 520, assume that the two samples are...Ch. 9.2 - In Exercises 520, assume that the two samples are...Ch. 9.2 - In Exercises 520, assume that the two samples are...Ch. 9.2 - In Exercises 520, assume that the two samples are...Ch. 9.2 - In Exercises 520, assume that the two samples are...Ch. 9.2 - In Exercises 520, assume that the two samples are...Ch. 9.2 - In Exercises 520, assume that the two samples are...Ch. 9.2 - In Exercises 520, assume that the two samples are...Ch. 9.2 - In Exercises 520, assume that the two samples are...Ch. 9.2 - In Exercises 520, assume that the two samples are...Ch. 9.2 - In Exercises 520, assume that the two samples are...Ch. 9.2 - In Exercises 520, assume that the two samples are...Ch. 9.2 - In Exercises 520, assume that the two samples are...Ch. 9.2 - In Exercises 520, assume that the two samples are...Ch. 9.2 - In Exercises 520, assume that the two samples are...Ch. 9.2 - Pooling Repeat Exercise 12 IQ and Lead by assuming...Ch. 9.2 - Degrees of Freedom In Exercise 20 Blanking Out on...Ch. 9.2 - No Variation in a Sample An experiment was...Ch. 9.3 - True? For the methods of this section, which of...Ch. 9.3 - Notation Listed below are body temperatures from...Ch. 9.3 - Units of Measure If the values listed in Exercise...Ch. 9.3 - Degrees of Freedom If we use the sample data in...Ch. 9.3 - In Exercises 516, use the listed paired sample...Ch. 9.3 - In Exercises 516, use the listed paired sample...Ch. 9.3 - In Exercises 516, use the listed paired sample...Ch. 9.3 - In Exercises 516, use the listed paired sample...Ch. 9.3 - In Exercises 516, use the listed paired sample...Ch. 9.3 - In Exercises 516, use the listed paired sample...Ch. 9.3 - Prob. 11BSCCh. 9.3 - Prob. 12BSCCh. 9.3 - In Exercises 516, use the listed paired sample...Ch. 9.3 - In Exercises 516, use the listed paired sample...Ch. 9.3 - In Exercises 516, use the listed paired sample...Ch. 9.3 - In Exercises 516, use the listed paired sample...Ch. 9 - In Exercises 15, use the following survey results:...Ch. 9 - In Exercises 1-5, use the following survey...Ch. 9 - In Exercises 1-5, use the following survey...Ch. 9 - In Exercises 1-5, use the following survey...Ch. 9 - In Exercises 7-5, use the following survey...Ch. 9 - True? Determine whether the following statement is...Ch. 9 - True? When we collect random samples to test the...Ch. 9 - Dependent or Independent? Listed below are...Ch. 9 - Hypotheses Identify the null and alternative...Ch. 9 - Test Statistics Identify the test statistic that...Ch. 9 - Denomination Effect In the article The...Ch. 9 - Denomination Effect Construct the confidence...Ch. 9 - Heights Listed below are heights (cm) randomly...Ch. 9 - Heights Use a 0.01 significance level with the...Ch. 9 - Before /After Treatment Results Captopril is a...Ch. 9 - Eyewitness Accuracy of Police Does stress affect...Ch. 9 - Are Flights Cheaper When Scheduled Earlier? Listed...Ch. 9 - Family Heights. In Exercises 15, use the following...Ch. 9 - Scatterplot Construct a scatterplot of the...Ch. 9 - Family Heights. In Exercises 1-5, use the...Ch. 9 - Family Heights. In Exercises 1-5, use the...Ch. 9 - Assessing Normality Interpret the normal quantile...Ch. 9 - Braking Reaction Times: Histogram Listed below are...Ch. 9 - Braking Reaction Times: Normal? The accompanying...Ch. 9 - Braking Reaction Times: Boxplots Use the same data...Ch. 9 - In Exercises 5-20, assume that the two samples are...Ch. 9 - Braking Reaction Times: Confidence Intervals a....Ch. 9 - FROM DATA TO DECISION Critical Thinking: Did the...Ch. 9 - Critical Thinking: Did the NFL Rule Change Have...Ch. 9 - Critical Thinking: Did the NFL Rule Change Have...
Knowledge Booster


Learn more about
Need a deep-dive on the concept behind this application? Look no further. Learn more about this topic, statistics and related others by exploring similar questions and additional content below.Similar questions
- Retinitis pigmentosa (RP) is a hereditary ocular diseasein which patches of pigment appear on the retina, potentially resulting in substantial vision loss and in somecases complete blindness. An important issue is how fastthe subjects decline. Visual field is an important measureof area of vision, which is measured in degree2. A visualfield area for a normal person is around 11,000 degree2.The longitudinal data in Table 11.29 were provided by anindividual patient.Table 11.29 Longitudinal visual field data forone RP patientTime Visual field area lnVisit (yr) (degree2) (visual field area)1 0 3059 8.032 1 3053 8.023 2 1418 7.264 3 1692 7.435 4 1978 7.596 5 1567 7.367 6 1919 7.568 7 1998 7.609 11 1648 7.4110 13 1721 7.4511 15 1264 7.14mean 6.09 1938 7.532sd 4.97 597 0.280Suppose the rate of change of ln (visual field) is a linearfunction of follow-up time.11.103 Write down a linear regression model that summarizes this relationship.11.104 Fit the regression line using the method of…arrow_forwardFoot ulcers are a common problem for people with diabetes. Higher skin temperatures on the foot indicate an increased risk of ulcers. The article "An Intelligent Insole for Diabetic Patients with the Loss of Protective Sensation" (Kimberly Anderson, M.S. Thesis, Colorado School of Mines), reports measurements of temperatures, in °F, of both feet for 181 diabetic patients. The results are presented in the following table. Left Foot Right Foot 80 80 85 85 75 80 88 86 89 87 87 82 78 78 88 89 89 90 76 81 89 86 87 82 78 78 80 81 87 82 86 85 76 80 88 89 Construct a scatterplot of the right foot temperature (y) versus the left foot temperature (x). Verify that a linear model is appropriate. b. Compute the least-squares line for predicting the right foot temperature from the left foot temperature. If the left foot temperatures of two patients differ by 2 degrees, by how much would you predict their right foot temperatures to differ? Predict the right foot temperature for a patient whose left…arrow_forwardThe authors of the paper "Statistical Methods for Assessing Agreement Between Two Methods of Clinical Measurement"† compared two different instruments for measuring a person's ability to breathe out air. (This measurement is helpful in diagnosing various lung disorders.) The two instruments considered were a Wright peak flow meter and a mini-Wright peak flow meter. Seventeen people participated in the study, and for each person air flow was measured once using the Wright meter and once using the mini-Wright meter. Subject Mini-WrightMeter WrightMeter Subject Mini-WrightMeter WrightMeter 1 512 494 10 445 433 2 430 395 11 432 417 3 520 516 12 626 656 4 428 434 13 260 267 5 500 476 14 477 478 6 600 557 15 259 178 7 364 413 16 350 423 8 380 442 17 451 427 9 658 650 (a) Suppose that the Wright meter is considered to provide a better measure of air flow, but the mini-Wright meter is easier to transport and to use. If the two types of meters produce different…arrow_forward
- The authors of the paper "Statistical Methods for Assessing Agreement Between Two Methods of Clinical Measurement"† compared two different instruments for measuring a person's ability to breathe out air. (This measurement is helpful in diagnosing various lung disorders.) The two instruments considered were a Wright peak flow meter and a mini-Wright peak flow meter. Seventeen people participated in the study, and for each person air flow was measured once using the Wright meter and once using the mini-Wright meter. Subject Mini-WrightMeter WrightMeter Subject Mini-WrightMeter WrightMeter 1 512 494 10 445 433 2 430 395 11 432 417 3 520 516 12 626 656 4 428 434 13 260 267 5 500 476 14 477 478 6 600 557 15 259 178 7 364 413 16 350 423 8 380 442 17 451 427 9 658 650 (a) Suppose that the Wright meter is considered to provide a better measure of air flow, but the mini-Wright meter is easier to transport and to use. If the two types of meters produce…arrow_forwardproduction of urc acid in the body can be an indication of cell breakdown. This may be an advance indication of illness such as gout, leukemia, or lymphoma over the period of thirteen months The mean concentrations was X = 5.33 mg/dI. The distribution of uric acid in healthy adult males can be assumed to be normal, with a =1.75 mg/di.arrow_forwardPulse Rates Listed below are pulse rates (beats per minute) from samples of adult males and females (from Data Set 1 “Body Data” in Appendix B). Does there appear to be a difference?arrow_forward
- Refer to laserjeans.xlsx to answer the questions below. These real data come from Ondogan, Z., Pamuk, O., Ondogan, E. N., & Ozguney, A. (2005). Improving the appearance of all textile products from clothing to home textile using laser technology. Optics and Laser Technology, 37, 631-637. Researchers sought to test the differences in tensile strength of jeans designed by hand versus those designed with lasers. 1. What type of measurement scale do each of the five variables use? 2. Create histograms for those that are continuous (interval or ratio). How would you describe the shape of these distributions? 3. A textile researcher wants to simplify the strength data by turning this continuous variable into an ordinal variable with 10 equal interval widths. Given that the lowest force resulting in a rip was 860 N, and the greatest force resulting in a rip was 1,450 N, what should the interval widths (also called bins or breaks) be? Fill in the second column of the…arrow_forwardDenny studied factors affecting cardiovascular reactivity to a postural change in a sample of healthy men and women. Change in systolic blood pressure (SBP) from supine to standing position was used as the measure of cardiac reactivity in a sample of 842 adults. Supine measurement of blood pressure was taken after participants had lain on an examination table for 15 minutes. Blood pressure was determined every 30 seconds using a Dinamap device for 2 minutes, and the measurements were averaged. Participants then stood up immediately, and additional measurements were made for another 2 minutes. Below is a table describing the characteristics of Denny’s sample: Which variables in the table, if any, were measured on a nominal scale? Which variables in the table, if any, were measured on an ordinal scale? Which variables in the table, if any, were measured on an interval scale? Which variables in the table, if any, were measured on a ratio scale? Which measures of central tendency, if any,…arrow_forwardDenny studied factors affecting cardiovascular reactivity to a postural change in a sample of healthy men and women. Change in systolic blood pressure (SBP) from supine to standing position was used as the measure of cardiac reactivity in a sample of 842 adults. Supine measurement of blood pressure was taken after participants had lain on an examination table for 15 minutes. Blood pressure was determined every 30 seconds using a Dinamap device for 2 minutes, and the measurements were averaged. Participants then stood up immediately, and additional measurements were made for another 2 minutes. Below is a table describing the characteristics of Denny’s sample: Which measures of dispersion, if any, are presented in this table (Ranges, SDs)? If age is normally distributed, approximately what percent of the sample would be younger than 50? If BMI is normally distributed, approximately what percent of the sample would have a BMI higher than 33.1?arrow_forward
- Denny studied factors affecting cardiovascular reactivity to a postural change in a sample of healthy men and women. Change in systolic blood pressure (SBP) from supine to standing position was used as the measure of cardiac reactivity in a sample of 842 adults. Supine measurement of blood pressure was taken after participants had lain on an examination table for 15 minutes. Blood pressure was determined every 30 seconds using a Dinamap device for 2 minutes, and the measurements were averaged. Participants then stood up immediately, and additional measurements were made for another 2 minutes. Below is a table describing the characteristics of Denny’s sample: Which variables in the table, if any, were measured on a ratio scale? Which measures of central tendency, if any, are presented in this table? Which measures of dispersion, if any, are presented in this table (Ranges, SDs)? Table 1 Characteristics of the Study Sample (N=842) Sample Characteristic Frequency (n) Percent or…arrow_forwardHow heavy a load (pounds) is needed to pull apart pieces of Douglas fir 4 inches long and 1.5 inches square? Students doing a laboratory exercise sample 20 pieces of wood and find an average load capacity of 30,841 pounds. We are willing to regard the wood pieces prepared for the lab session as an SRS of all similar pieces of Douglas fir. Engineers also commonly assume the characteristics of materials vary normally. Suppose that the strength of pieces of wood like these follow a normal distribution with a population standard deviation of 3,000 pounds (As you can see all three necessary assumptions are met). a. Assuming that all evergreen wood has a known "load" capacity average of 30,000 pounds. Make a two-sided hypothesis (null and alternative statement) about Douglas Fir "load" capacity compared to the overall average. b. Apply the formula for finding our test statistic (show your work or describe the process) Specifically, use the formula for the z-statistic (pasted below and on…arrow_forwardAccording to recent UN figures, the annual gun homicide rate is 62.4 per one mil- lion residents in the US and 1.3 per one million residents in Britain. Compare the proportion of residents killed annually by guns using the (a) difference of propor- tions, (b) relative risk. Which measure is more useful for describing the strength of association? Why?arrow_forward
arrow_back_ios
SEE MORE QUESTIONS
arrow_forward_ios
Recommended textbooks for you
 MATLAB: An Introduction with ApplicationsStatisticsISBN:9781119256830Author:Amos GilatPublisher:John Wiley & Sons Inc
 Probability and Statistics for Engineering and th...StatisticsISBN:9781305251809Author:Jay L. DevorePublisher:Cengage Learning
 Statistics for The Behavioral Sciences (MindTap C...StatisticsISBN:9781305504912Author:Frederick J Gravetter, Larry B. WallnauPublisher:Cengage Learning
 Elementary Statistics: Picturing the World (7th E...StatisticsISBN:9780134683416Author:Ron Larson, Betsy FarberPublisher:PEARSON
 The Basic Practice of StatisticsStatisticsISBN:9781319042578Author:David S. Moore, William I. Notz, Michael A. FlignerPublisher:W. H. Freeman
 Introduction to the Practice of StatisticsStatisticsISBN:9781319013387Author:David S. Moore, George P. McCabe, Bruce A. CraigPublisher:W. H. Freeman
MATLAB: An Introduction with Applications
Statistics
ISBN:9781119256830
Author:Amos Gilat
Publisher:John Wiley & Sons Inc
Probability and Statistics for Engineering and th...
Statistics
ISBN:9781305251809
Author:Jay L. Devore
Publisher:Cengage Learning
Statistics for The Behavioral Sciences (MindTap C...
Statistics
ISBN:9781305504912
Author:Frederick J Gravetter, Larry B. Wallnau
Publisher:Cengage Learning
Elementary Statistics: Picturing the World (7th E...
Statistics
ISBN:9780134683416
Author:Ron Larson, Betsy Farber
Publisher:PEARSON
The Basic Practice of Statistics
Statistics
ISBN:9781319042578
Author:David S. Moore, William I. Notz, Michael A. Fligner
Publisher:W. H. Freeman
Introduction to the Practice of Statistics
Statistics
ISBN:9781319013387
Author:David S. Moore, George P. McCabe, Bruce A. Craig
Publisher:W. H. Freeman
Hypothesis Testing using Confidence Interval Approach; Author: BUM2413 Applied Statistics UMP;https://www.youtube.com/watch?v=Hq1l3e9pLyY;License: Standard YouTube License, CC-BY
Hypothesis Testing - Difference of Two Means - Student's -Distribution & Normal Distribution; Author: The Organic Chemistry Tutor;https://www.youtube.com/watch?v=UcZwyzwWU7o;License: Standard Youtube License