
Videos
The following summary data on bending strength (lb-in/in) of joints is taken from the article “Bending Strength of Corner Joints Constructed with Injection Molded Splines” (Forest Products J., April, 1997: 89–92).
| Sample | Sample | Sample | |
| Type | Size | SD | |
| Without side coating | 10 | 80.95 | 9.59 |
| With side coating | 10 | 63.23 | 5.96 |
a. Calculate a 95% lower confidence bound for true average strength of joints with a side coating.
b. Calculate a 95% lower prediction bound for the strength of a single joint with a side coating. c. Calculate an interval that, with 95% confidence, includes the strength values for at least 95% of the population of all joints with side coatings.
d. Calculate a 95% confidence interval for the difference between true average strengths for the two types of joints.
a.
Calculate the 95% lower confidence bound for the true average strength of the joints with a side coating.
Answer to Problem 72SE
The 95% lower confidence bound for the true average bending strength of the joints with a side coatingis at least59.78(lb-in/in).
Explanation of Solution
Given info:
The information is based on the bending strength (lb-in/in) of the joints:
Let
Calculation:
Lower Confidence interval:
The Lower Confidence level can be defined is,
Where
Lower Confidence interval:
Step-by-step procedure to obtain the confidence interval using the MINITAB software:
- Choose Stat > Basic Statistics > One sample t.
- Choose Summarized columns. Enter the sample mean as 63.23 and standard deviation as 5.96.
- Choose Options.
- In Confidence level, enter 95.
- In Alternative, select Greater than.
- Click OK in all the dialog boxes.
Output using the MINITAB software is given below:
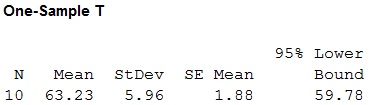
From the MINITAB output, the lower confidence bound is 59.78.
Interpretation:
Thus, The 95% lower confidence bound for the true average bending strength of the joints with a side coating is at least 59.78(lb-in/in).
b.
Calculate the 95% lower prediction bound for the true average strength of the single joint with a side coating.
Answer to Problem 72SE
The 95% lower prediction bound for the true average bending strength of the single joint with a side coating will be at least 51.77(lb-in/in).
Explanation of Solution
Given info:
Let
Calculation:
Lower Prediction interval:
Where
Degrees of freedom:
The degrees of freedom is
Thus, for sample of size 10,
Hence, the degrees of freedom are 9.
Level of significance:
It is given that the level of significance is 0.05.
The lower prediction bound for the true average bending strength of the single joint with a side coating is obtained as given below:
From Appendix Tables, “Table A.5 Critical Values for t Distribution”, the critical value for the 9df with level of significance 0.025 is
The lower prediction bound is given by;
Thus, the 95% lower prediction bound is 51.77.
Thus, the 95% lower prediction bound for the true average bending strength of the single joint with a side coating will be at least 51.77(lb-in/in).
c.
Calculate the 95% confidence interval that includes the strength values for at least 95% of the population of all joints with side coatings.
Answer to Problem 72SE
The 95% confidence interval that includes the strength values for at least 95% of the population of all joints with side coatings lies between 43.09(lb-in/in) and 83.37(lb-in/in).
Explanation of Solution
Given info:
Let
Calculation:
To find thestrength values for at least 95%, use the method of tolerance interval.
Tolerance interval:
Where
Degrees of freedom:
The degrees of freedom is
Thus, for sample of size 10,
Hence, the degrees of freedom are 9.
Level of significance:
It is given that the level of significance is 0.05.
The tolerance intervalthat includes the strength values for at least 95% of the population of all joints with side coatings is obtained as given below:
From Appendix Tables, “Table A.6 Tolerance Critical Values for Normal population Distribution”, the tolerance critical value for the n = 10 with confidence level 95% for 95% population is
The interval is given by;
Thus, the 95% tolerance interval is (43.09, 83.37).
Thus, the 95% tolerance interval that includes the strength values for at least 95% of the population of all joints with side coatings lies between 43.09(lb-in/in) and 83.37(lb-in/in).
Interpretation:
Hence it is highly confident that at least 95% of the population of all joints with side coatings have the bend strength between 43.09(lb-in/in) and 83.37(lb-in/in).
d.
Find the 95% confidence interval for the difference between two average strengths for the two types of joints.
Answer to Problem 72SE
The interpretation is, there is 95% confidence that the average strength for the joints without side coating is greater than that of strength for the joints with side coating by between10.11(lb-in/in) and 25.33(lb-in/in).
Explanation of Solution
Given info:
Let
Calculation:
Let
Requirements for a two sample t-test:
- The sample X and Y taken from the population is selected at random.
- The samples X and Y are dependent of each other.
- Samples must be distributed to normal.
Here, the samples selected from the strength without coating and with coating were selected at random and dependent. Moreover, the sample size is assumed to be normally distributed. Hence, the assumptions are satisfied.
Thus, the condition is satisfied.
Confidence interval:
The confidence interval is given as,
Where
Confidence interval:
Step-by-step procedure to obtain the confidence interval using the MINITAB software:
- Choose Stat > Basic Statistics > 2-sample t test.
- Choose Summarized data.
- In first, enter Sample size as 10, Mean as 80.95, Standard deviation as 9.59.
- In second, enter Sample size as 10, Mean as 63.23, Standard deviation as 5.96.
- Choose Options.
- In Confidence level, enter 95.
- In Alternative, select Not equal.
- Click OK in all the dialog boxes.
Output using the MINITAB software is given below:
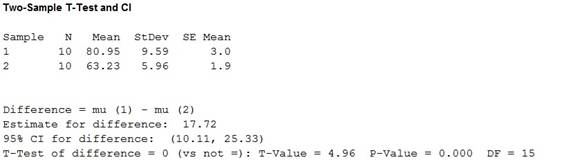
From the MINITAB output, the confidence interval is (10.11, 25.33).
Thus, there is 95% confidence that the average strength for the joints without side coating is greater than that of strength for the joints with side coating by between 10.11(lb-in/in).and 25.33(lb-in/in).
Want to see more full solutions like this?
Chapter 9 Solutions
Student Solutions Manual for Devore's Probability and Statistics for Engineering and the Sciences, 9th


- A wine enthusiast named Suds collected data on the alc content (percent by volume) of wine for one grape variety in 2012 by a random sample of winemakers in Italy. Suds created the following Table: Alcohol % Mean 13.093 Std Error 0.1143 Median 13.165 Mode 13.17 Std Deviation 0.5111 Sample Variance 0.2612 Kurtosis -0.8385 Skew -0.1747 Range 1.68 Minimum 12.2 Maximum 13.88 Sum 261.86 Count 20 Use the table to determine whether mean alc content of all wines for that grape in 2012 in Italy was greater than 12.75% at the 0.1 significance. a) State the null and alternaternative hypothesis. b) What is the calculated value of the associated test statistic and what is the critical value of the associated test statistic? c) State your decision about the null hypothesis by comparing calculated and critical values of the statistic. State your conclusion(describe what the decision means in this problem).arrow_forwardShear strength measurements derived from unconfined compression tests for two types of sols gave the results shown in the following table (measurements in tons per square foot). Do the soils appear to differ with respect to the variation of the shear strength, at the 10% significance level? Soil Soil Type Турe l II sample size 10 sample 1.57 1.92 mean sample std dev 0.17 0.22 Let the strength measurement of soil type I be the first population and the strength measurement of soil type II be the second. a. Choose the answer : 1) Alternative Hypothesis: The population variation of the shear strength for soil type l is > that of soil type I. 2) Alternative Hypothesis: The population variation of the shear strength for soil type I is < that of soil type II. 3) Alternative Hypothesis: The sample variation of the shear strength for soil type l is not equal to that of soil type II. 4) Alternative Hypothesis: The population variation of the shear strength for soil type l is not equal to that of…arrow_forwardThe corrosive effects of various soils on coated and uncoated steel pipe was tested by using a dependent sampling plan. The data collected are summarized below, where d is the amount of corrosion on the coated portion subtracted from the amount of corrosion on the uncoated portion. Does this random sample provide sufficient reason to conclude that the coating is beneficial? Use ? = 0.01 and assume normality. n = 44, Σd = 224, Σd2 = 6268(a) Find t. (Give your answer correct to two decimal places.) (ii) Find the p-value. (Give your answer correct to four decimal places.) (b) State the appropriate conclusion. Reject the null hypothesis, there is significant evidence that the coating is beneficial.Reject the null hypothesis, there is not significant evidence that the coating is beneficial. Fail to reject the null hypothesis, there is significant evidence that the coating is beneficial.Fail to reject the null hypothesis, there is not significant evidence that the coating is beneficial.arrow_forward
 Glencoe Algebra 1, Student Edition, 9780079039897...AlgebraISBN:9780079039897Author:CarterPublisher:McGraw Hill