
Videos
Fusible interlinings are being used with increasing frequency to support outer fabrics and improve the shape and drape of various pieces of clothing. The article “Compatibility of Outer and Fusible Interlining Fabrics in Tailored Garments” (Textile Res. J., 1997: 137–142) gave the accompanying data on extensibility (%) at 100 gm/cm for both high-quality (H) fabric and poor-quality (P) fabric specimens.
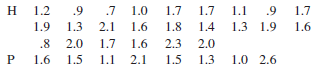
a. Construct normal
b. Construct a comparative box plot. Does it suggest that there is a difference between true average extensibility for high-quality fabric specimens and that for poor-quality specimens?
c. The sample mean and standard deviation for the high quality sample are 1.508 and .444, respectively, and those for the poor-quality sample are 1.588 and .530. Use the two-sample t test to decide whether true average extensibility differs for the two types of fabric

Trending nowThis is a popular solution!

Chapter 9 Solutions
Student Solutions Manual for Devore's Probability and Statistics for Engineering and the Sciences, 9th


- The article “Uncertainty Estimation in Railway TrackLife-Cycle Cost” (J. of Rail and Rapid Transit, 2009)presented the following data on time to repair (min) a railbreak in the high rail on a curved track of a certain railway line.159 120 480 149 270 547 340 43 228 202 240 218A normal probability plot of the data shows a reasonably linear pattern, so it is plausible that the populationdistribution of repair time is at least approximately normal. The sample mean and standard deviation are 249.7 and 145.1, respectively. a. Is there compelling evidence for concluding that trueaverage repair time exceeds 200 min? Carry out atest of hypotheses using a significance level of .05. b. Using std= 150, what is the type II error probabilityof the test used in (a) when true average repair timeis actually 300 min? That is, what is b(300)?arrow_forwardSuppose a researcher is interested in the effectiveness of a new novel talk therapy technique in reducing overall depression as identified via score report on the geriatric depression scale (GDS). In order to carry out this hypothesis, the researcher gathers a SRS of participants in the program and performs the GDS test prior to, and after initiation of the new therapy technique. Assume the SRS score report presented below represents an approximately normal distribution. Participant GDS Score (Out of 15) Prior to intervention GDS Score (Out of 15) Following intervention A 12 8 B 13 7 C 12 7 D 14 9 E 11 6 F 11 7 A) What type of study design is this? B) Conduct a paired sample t test investigating the effectiveness of the new therapy technique with 95% confidence. Write out your null and alternative hypotheses, and interpret your pvalue correctly. C) Construct a 95% confidence interval representing the average difference…arrow_forward.. .. Young's modulus is a quantitative measure of stiffness of an elastic material. Suppose that for aluminum alloy sheets of a particular type, its mean value and standard deviation are 70 GPa and 1.6 GPa, respectively (values given in the article "Influence of Material Properties Variability on Springback and Thinning in Sheet Stamping Processes: A Stochastic Analysis" (Intl. J. of Advanced Manuf. Tech., 2010: 117-134)). (a) If X is the sample mean Young's modulus for a random sample of n = 16 sheets, where is the sampling distribution of X centered, and what is the standard deviation of the X distribution? E(X) GPa %3D GPa (b) Answer the questions posed in part (a) for a sample size of n = 64 sheets. E(X) = GPa GPa (c) For which of the two random samples, the one of part (a) or the one of part (b), is X more likely to be within 1 GPa of 70 GPa? Explain your reasoning. X is more likely to be within 1 GPa of the mean in part (b). This is due to the decreased variability of X that…arrow_forward
- Carbon monoxide (CO) emissions for a certain kind of car vary with mean 2.715 g/mi and standard deviation 0.8 g/mi. A company has 60 of these cars in its fleet. Let y represent the mean CO level for the company's fleet. a) What's the approximate model for the distribution of y?Explain. b) Estimate the probability that y is between 2.8 and 2.9 g/mi. c) There is only a 10% chance that the fleet's mean CO level is greater than what value?arrow_forwardThe minimum fatigue life of rivets in the fuselage of a certain type of aircraft is modeled with a two-parameter Weibull distribution (&=0). During accelerated testing for the purpose of certification and approval by the FAA, the mean value of minimum life is found to be 90 minutes and the coefficient of variation is 15%. The rivet design is unacceptable if the minimum life during accelerated testing is less than 50 minutes. What is the probability of non-acceptance of the rivet design?arrow_forwardBob’s z-score for the last exam was 1.52 in Prof. Axolotl’s class BIO 417, "Life Cycle of the Ornithorhynchus." Bob said, "Oh, good, my score is in the top 10 percent." Assuming a normal distribution of scores, is Bob right? Multiple Choice No Yes Must have n to answer.arrow_forward
- Reading test scores for Miss Brown's class averaged 75.9. Nationally, the scores were normally distributed with a mean of 60.3 and a variance of 61.2. A) What is the z-score for Miss Brown's class average? B) Assume that the distribution of all scores was a normal distribution. How did Miss Brown's average compare to the nation's average? What percent of the nation's classes had averages below Miss Brown's average?arrow_forwardTest the hypothesis that the average content of containers of a particular lubricant is 10 liters if the contents of a random sample of 10 containers are {10.2, 9.7, 10.1, 10.3, 10.1, 9.8, 9.9, 10.4, 10.3, 9.8}. Use a 0.01 level of significance and assume that the distribution of contents is normal. Additionally, use P-value to corroborate your decision.arrow_forward
 Glencoe Algebra 1, Student Edition, 9780079039897...AlgebraISBN:9780079039897Author:CarterPublisher:McGraw Hill