
The question requires us to draw a graph representing a quota, the demand
Explanation of Solution
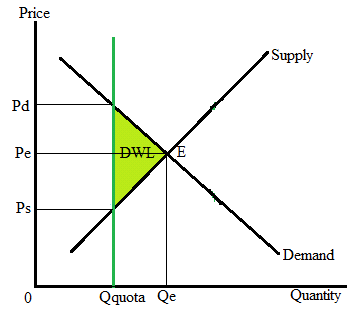
The following graph represents the supply-demand diagram with quota:
Here,
Without quota, the market is producing at point E where:
Equilibrium quantity = Qe
When the government sets the quota at Qquota,
The demand price = Pd
The supply price = Ps
Quota rent = demand price − supply price = Pd − Ps
A quote puts an upper limit on the quantity sold or purchased in a market. Quota brings inefficiency in the market by generating a
The difference between the supply price and the demand price represents the quota rent.
Chapter 9 Solutions
Krugman's Economics For The Ap® Course


 Principles of Economics (12th Edition)EconomicsISBN:9780134078779Author:Karl E. Case, Ray C. Fair, Sharon E. OsterPublisher:PEARSON
 Engineering Economy (17th Edition)EconomicsISBN:9780134870069Author:William G. Sullivan, Elin M. Wicks, C. Patrick KoellingPublisher:PEARSON
 Principles of Economics (MindTap Course List)EconomicsISBN:9781305585126Author:N. Gregory MankiwPublisher:Cengage Learning
 Managerial Economics: A Problem Solving ApproachEconomicsISBN:9781337106665Author:Luke M. Froeb, Brian T. McCann, Michael R. Ward, Mike ShorPublisher:Cengage Learning
 Managerial Economics & Business Strategy (Mcgraw-...EconomicsISBN:9781259290619Author:Michael Baye, Jeff PrincePublisher:McGraw-Hill Education