Find the maximum positive shear and bending moment at point B.
Answer to Problem 13P
The maximum positive shear at point B is
The maximum positive bending moment at point B is
Explanation of Solution
Calculation:
Apply a 1 kN unit moving load at a distance of x from left end A.
Sketch the free body diagram of beam as shown in Figure 1.
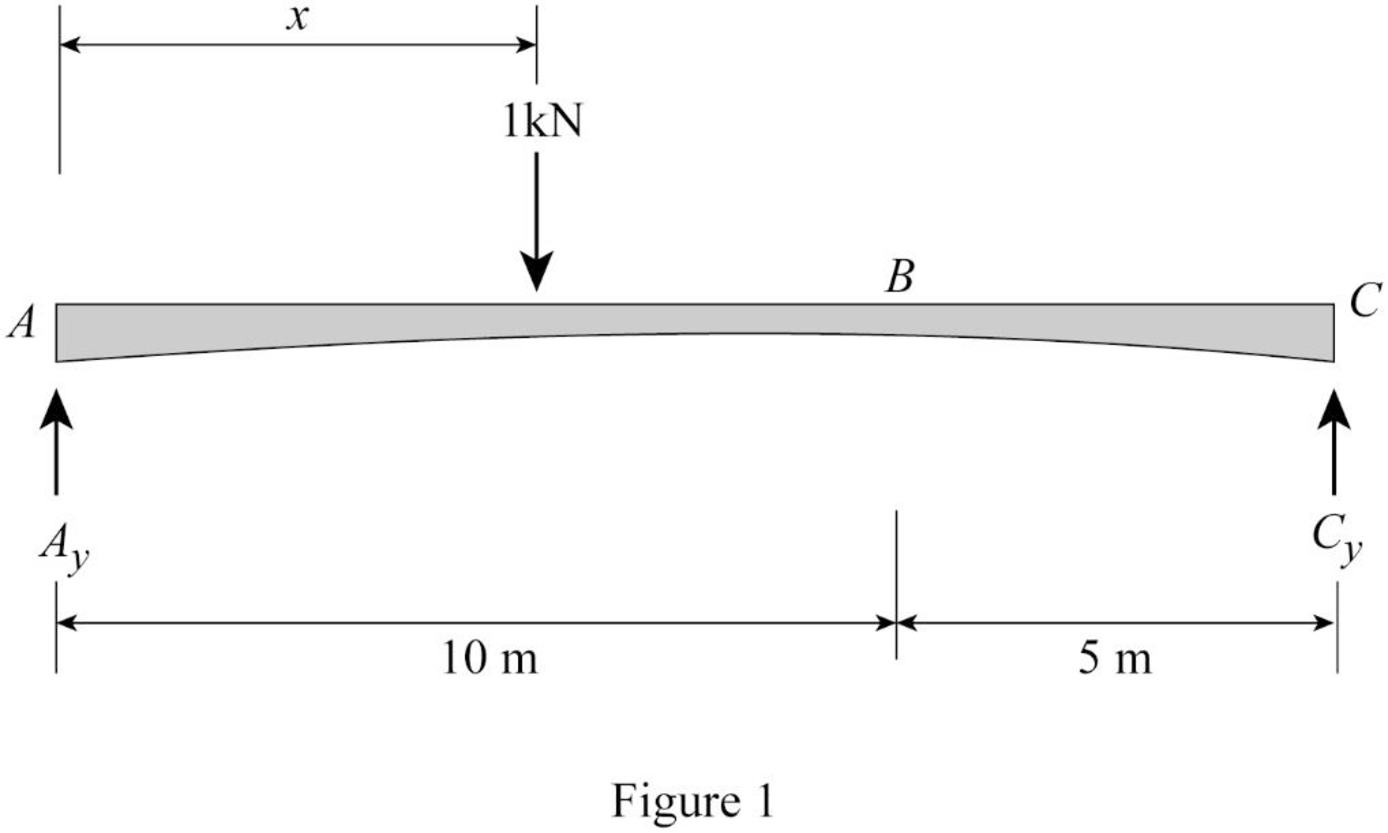
Refer Figure 1.
Find the equation of support reaction
Take moment about point C.
Consider moment equilibrium at point C.
Consider clockwise moment as positive and anticlockwise moment as negative.
Sum of moment at point C is zero.
Find the equation of support reaction
Apply vertical equilibrium equation of forces.
Consider upward force as positive
Substitute
Influence line for shear at point B.
Find the equation of shear force at B of portion AB
Sketch the free body diagram of the section AB as shown in Figure 2.
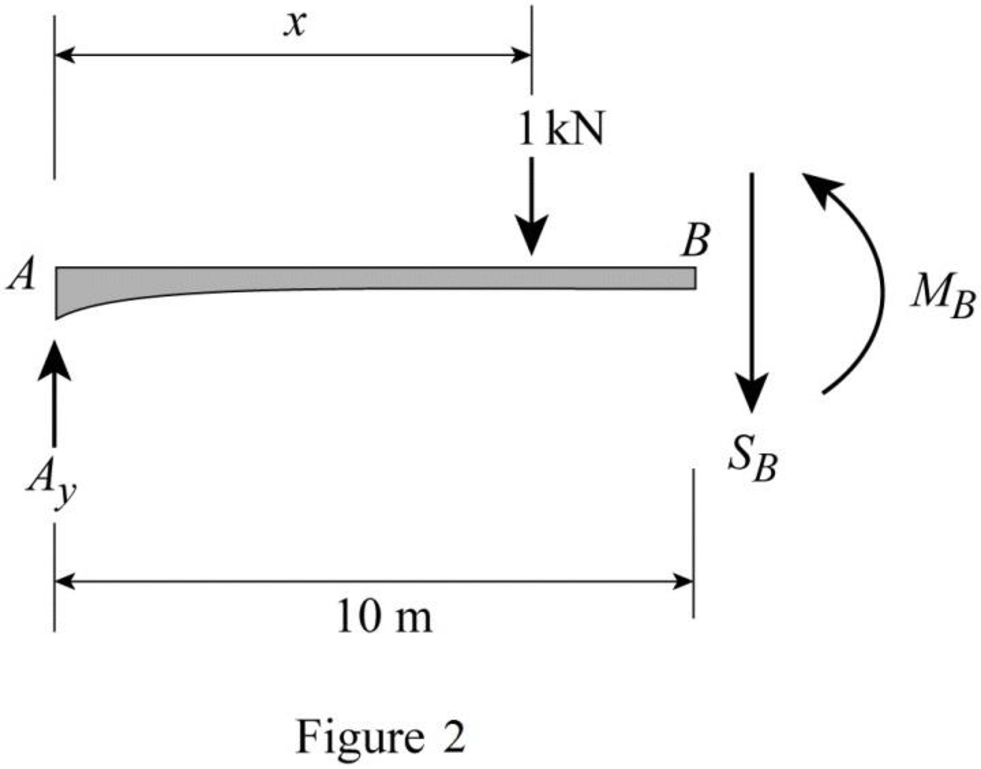
Refer Figure 2.
Apply equilibrium equation of forces.
Consider upward force as positive
Substitute
Find the equation of shear force at B of portion BC
Sketch the free body diagram of the section BC as shown in Figure 3.
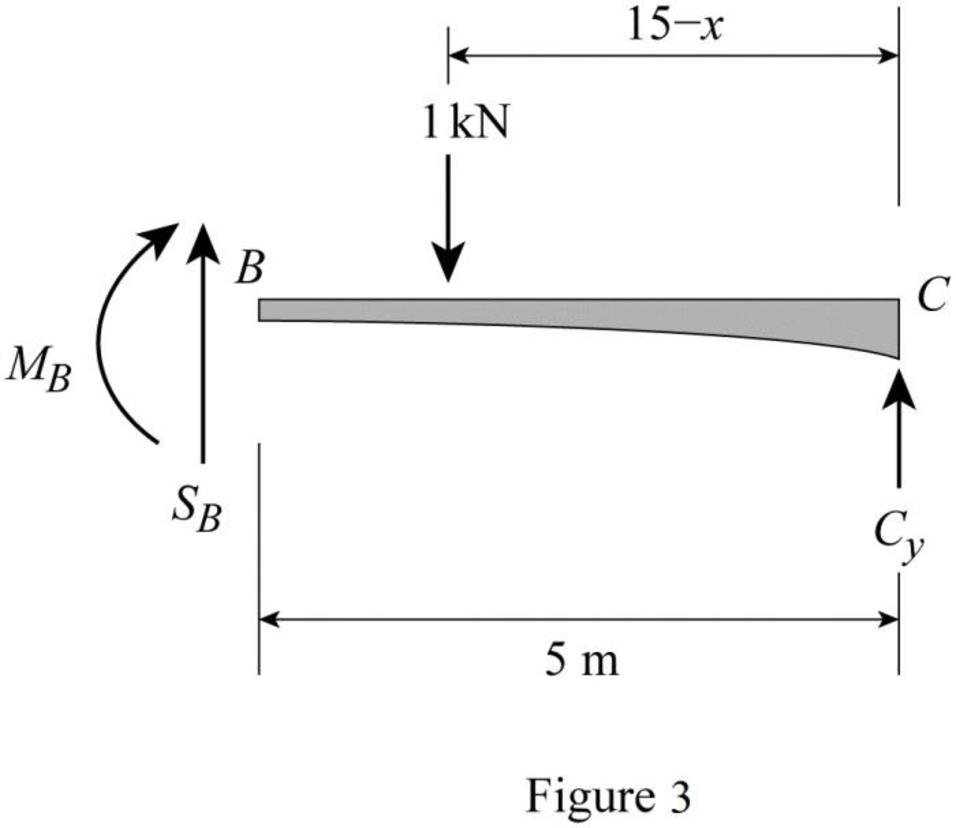
Refer Figure 3.
Apply equilibrium equation of forces.
Consider upward force as positive
Substitute
Thus, the equations of the influence line for
Find the value of influence line ordinate of shear force at various points of x using the Equations (3) and (4) and summarize the value as in Table 1.
| x | |
| 0 | 0 |
| 16 | 0 |
Draw the influence lines for the shear force at point B using Table 1 as shown in Figure 4.
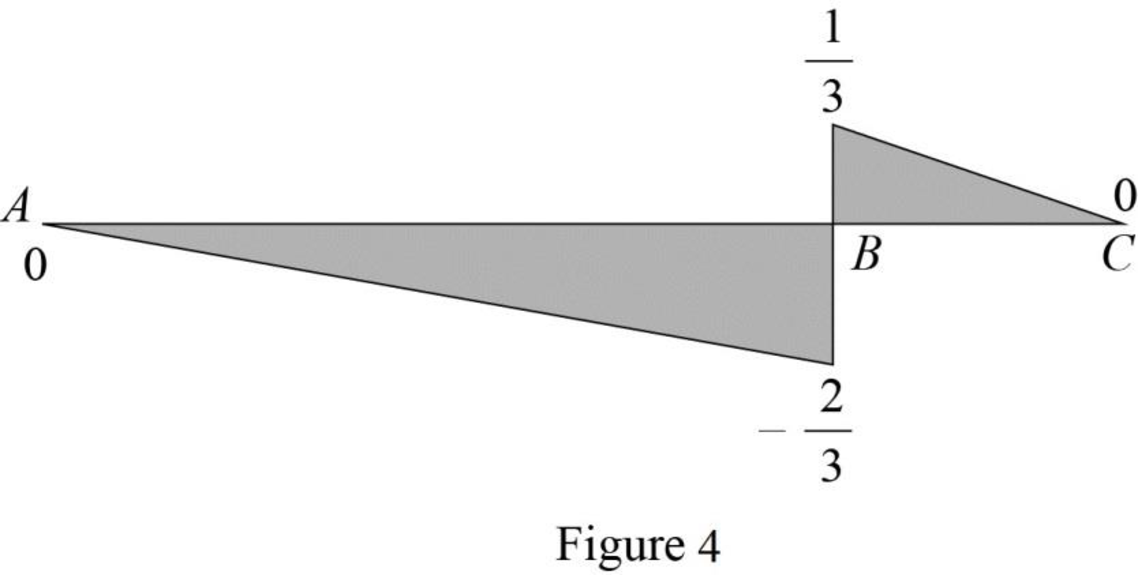
Refer Figure 4.
Find the slope
Here,
Substitute 10 m for
Find the slope
Here,
Substitute 5 m for
Sketch the loading position as shown in Figure 5.
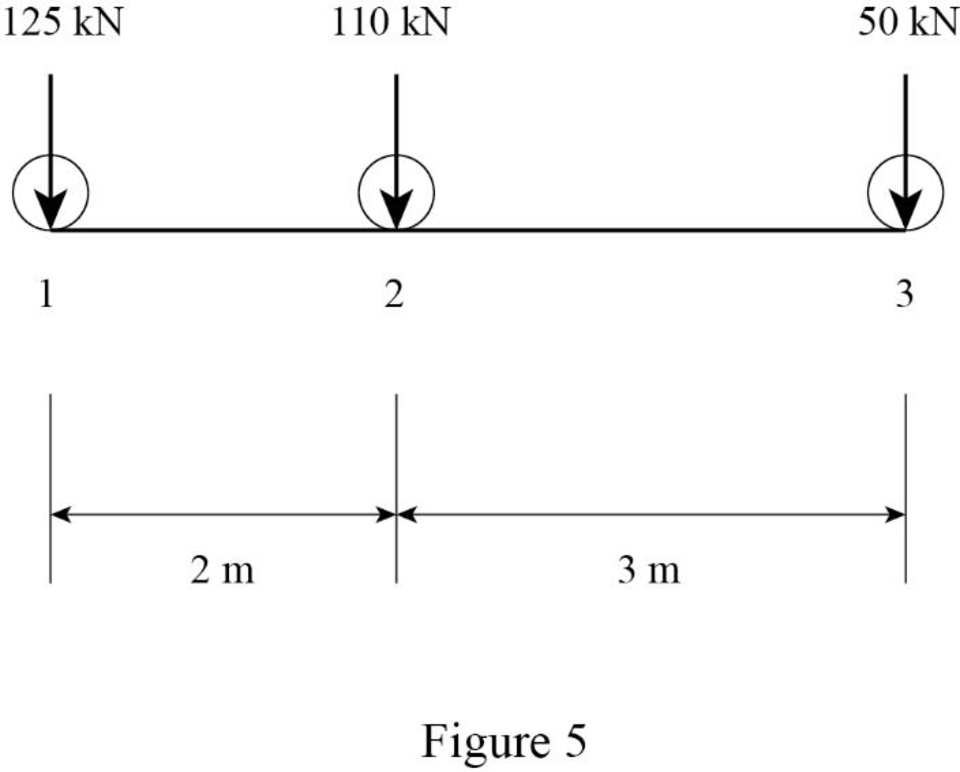
Find the maximum positive shear force at B.
Sketch the loading position on the beam when the load 1 placed at just right of B as shown in Figure 6.
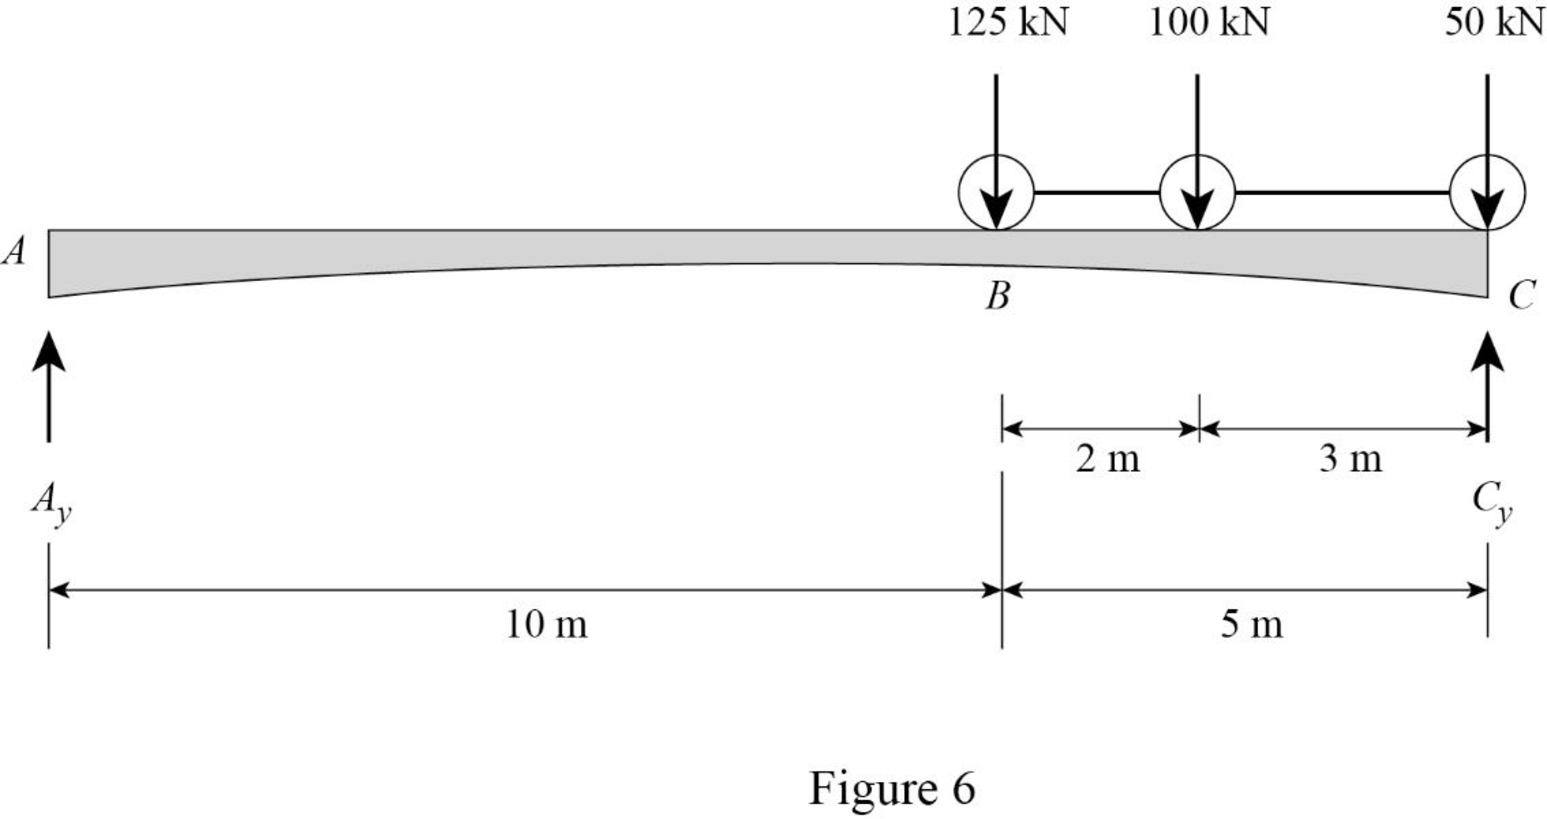
Refer Figure 6.
Find the shear force at B when the load 1 placed at just right of B.
Substitute 5 m for
Sketch the loading position on the beam when the load 2 placed at just right of B as shown in Figure 7.
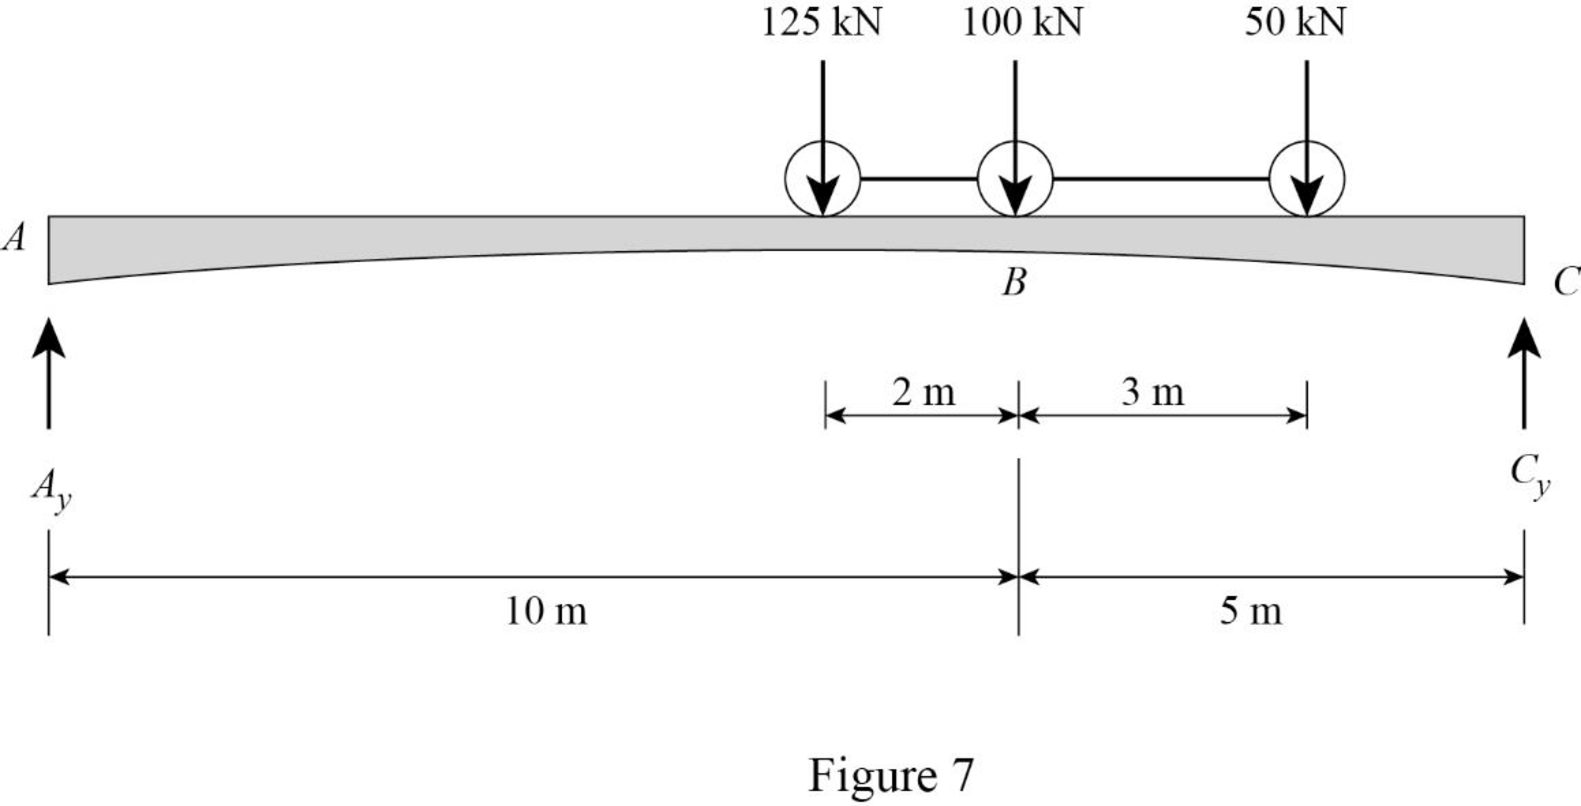
Refer Figure 7.
Find the shear force at B when the load 2 placed at just right of B.
Substitute 10 m for
Sketch the loading position on the beam when the load 3 placed at just right of B as shown in Figure 8.
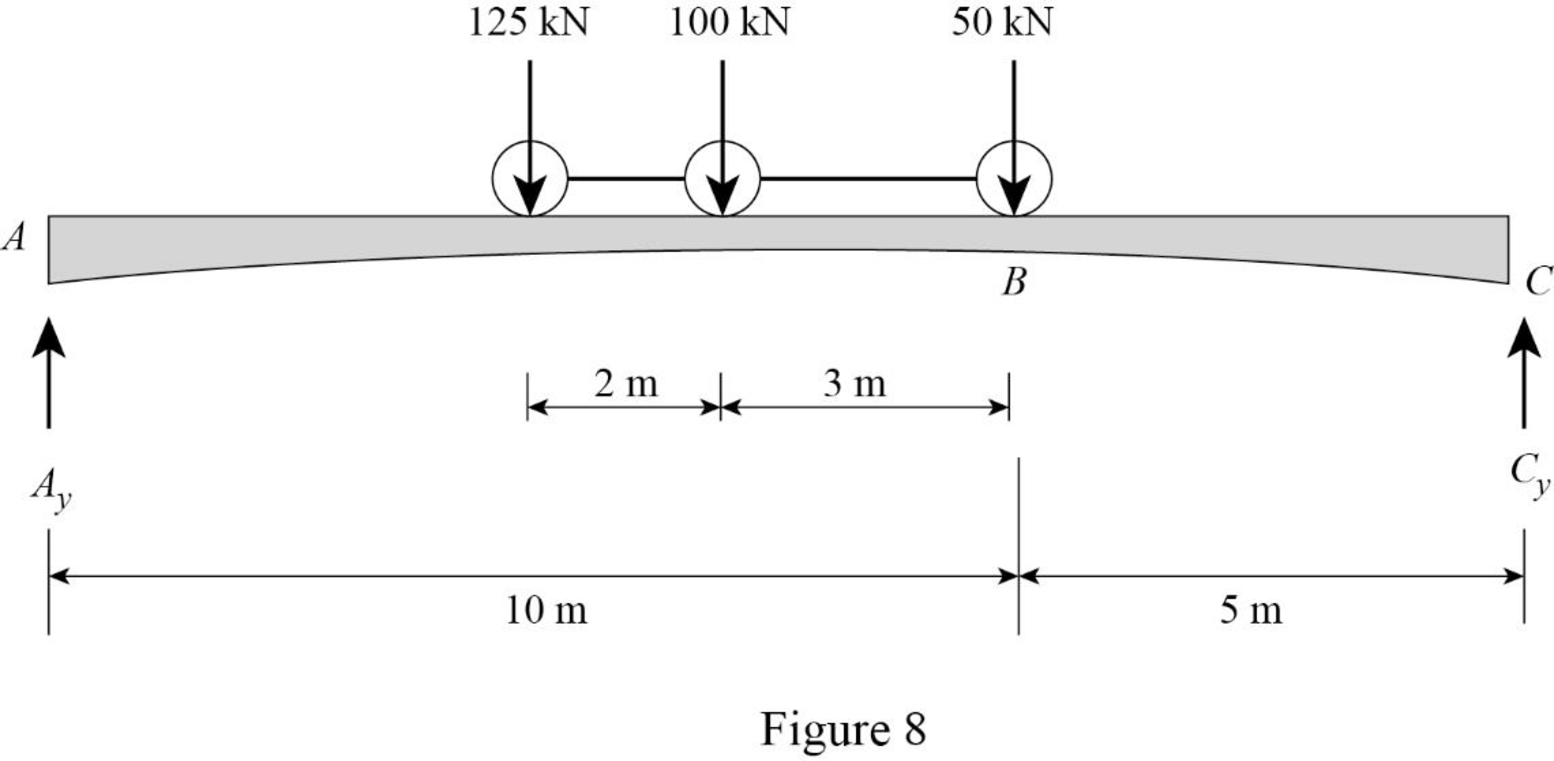
Refer Figure 8.
Find the shear force at B when the load 3 placed at just right of B.
Substitute 10 m for
Maximum positive shear force at B as follows.
The maximum positive shear at B is the maximum of
Therefore, the maximum positive shear at point B is
Influence line for moment at B.
Refer Figure 2.
Consider clockwise moment as positive and anticlockwise moment as negative.
Find the equation of moment at B of portion AB
Substitute
Refer Figure 3.
Consider clockwise moment as negative and anticlockwise moment as positive.
Find the equation of moment at B of portion BC
Substitute
Thus, the equations of the influence line for
Find the value of influence line ordinate of moment at various points of x using the Equations (5) and (6) and summarize the value as in Table 2.
| x | |
| 0 | 0 |
| 10 | |
| 15 | 0 |
Draw the influence lines for the moment at point B using Table 2 as shown in Figure 9.
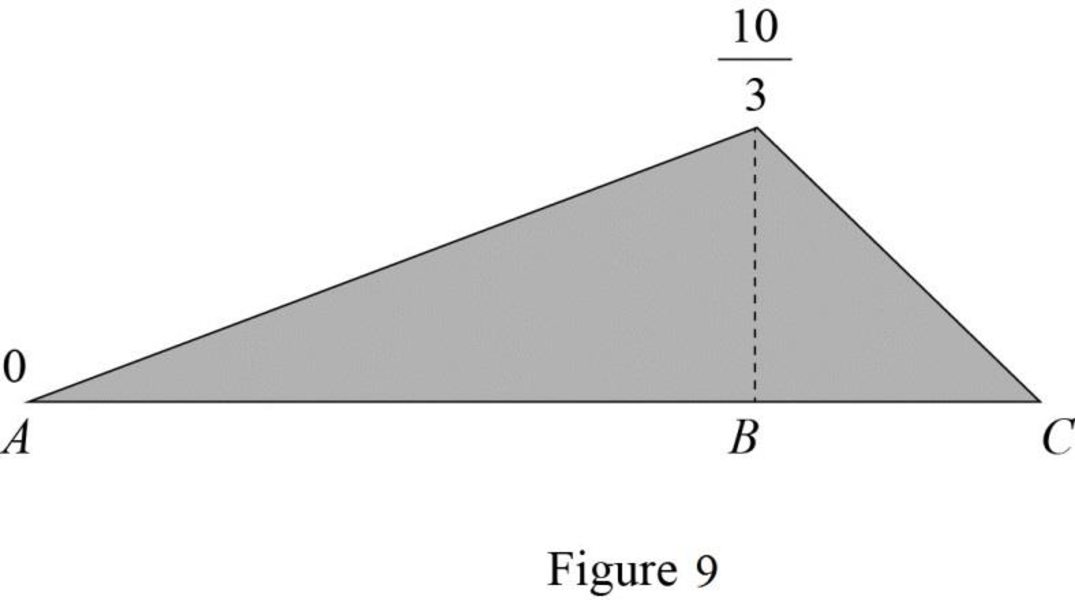
Refer Figure 9.
Find the slope
Here,
Substitute 10 m for
Find the slope
Here,
Substitute 5 m for
Find the maximum positive bending moment at B.
Refer Figure 6.
Find the bending moment at B when the load 1 placed at just right of B.
Substitute 5 m for
Refer Figure 7.
Find the bending moment at B when the load 2 placed at just right of B.
Substitute 10 m for
Refer Figure 8.
Find the bending moment at B when the load 3 placed at just right of B.
Substitute 10 m for
Maximum positive bending moment at B. as follows.
The maximum positive bending moment at B is the maximum of
Therefore, the maximum positive bending moment at point B is
Want to see more full solutions like this?
Chapter 9 Solutions
Structural Analysis, Si Edition (mindtap Course List)

- Prob. 4.3-13. The solid circular shaft in Fig. P4.3-13 is sub- jected to a distributed external torque that varies linearly from intensity of to per unit of length at x = 0 to zero at x = L. The shaft has a diameter d and shear modulus G and is fixed to a rigid wall at x = 0. (a) Determine an expression for the maximum (cross-sectional) shear stress in the shaft as a function of the distance x from the left end. (b) Deter- mine an expression for the total angle twist, d. at the free end. The shear modulus of elasticity is G. C to -t(x) P4.3-13 OBarrow_forward4. Determine the reaction at support A for the cantilever beam as shown in Figure 4. If the couple moment at point B is moved to point C, would it affects the reaction at Point A? D. 12kN A OkNm, 10KN 60° 4m Fig. 4arrow_forwardQ-1 The rigid frame shown in Fig.I is pinned at A and roller supported at D. For the given loading, determine the support reactions and draw the axial force, shear force and bending moment diagrams. 17.5 kN/m 4.5 m 112 kN в + 67.5 kN 6 m 4.5 m Fig.1 9 marrow_forward
- 1. Shown in Figure 1 is a beam subjected to varying loadings and a point load. 12 kN 3kN/m 6 kN/m a) Determine the magnitude and direction of the force equivalent to the forcing system. Specify its location on the beam from point B. A 5m b) Calculate for the support reactions at A and B. Fig. Iarrow_forwardQ5:For the force system shown in Fig .(5): A: Draw (F.B.D) for the force systen.. F=600N B: Determine the magnitude and direction of force (P) which make the force system in equilibrium state. Fig.(5) 500Narrow_forward3- The beam shown in Fig.2.3 is of uniform cross-section having flexural rigidity El=10 000 kNm². Calculate the displacements (lateral and rotationa!) at the free end and the rotational displacement at the prop support. 2m. Fig. 2.3 Im D 10 KNarrow_forward
- Determine the absolute maximum bending moment in a 15-m-long simply supported beam due to the series of three moving concentrated loads shown in Fig. P9.13.arrow_forward60 100 60 30 200 10 50 100s 2000 400 300 120 VA 12" FIG. P 2-17 6' 2-18. Determine the resultant of the parallel, coplanar force system shown in Fig. P 2-18 and locate it with respect to point A. FIG. P 2-18arrow_forward5.9: For the beam in Fig. P5.9, determine the extreme value of the shearing force and bending moment at point D due to the concentrated live load of 30 kN, a unifomly distributed live load of 3 kN/m (of any length), and a uniformly distributed dead load of 1 kN/m. D E F A 20 m 30 m 30 m 15 m y15 m 20 m Figure P5.9 = 1937.5 (Max. Vp = 60.417 kN; Min. VD = -45.833 kN; Max. Mp %3D %3D kN.m; Min. Mp = -1100 kN.m)arrow_forward
- 2.22 Determine the magnitude and sense of the moment of the 800-N force about point A. 800 N 38° 0.6 m A 0.5 m Fig. P2.22arrow_forward2 In the beam ABC shown in Fig. P.16.32 the support at B settles by 10 mm when the loads are applied. If the second moment of area of the spans AB and BC are 83.4×10° mm“ and 125.1x10° mm“, respectively, and Young's modulus, E,of the material of the beam is 207000 N/mm², calculate the support reactions using the moment distribution method. Ans. Rc=28.6 kN, Rg=15.8 kN, RA=30.5 kN, MA=53.9 kNm.arrow_forwardDetermine the reactions and draw the shear and bending moment diagrams for the beams shown by using the slope deflection method. PLEASE REFER TO FIG. P16.3arrow_forward
