
Concept explainers
Videos
(a)
To calculate:The shape, center, and the spread of the sampling distribution of the selected people appeared for the National Assessment of Educational Progress test.
(a)
Answer to Problem 5E
Shape is approximately normal, center is 280 and the spread is 2.0702.
Explanation of Solution
Given information:
Sample mean of the score = 280
Standard deviation = 60
Calculation:
Sample mean
Standard deviation
Sample size = 840
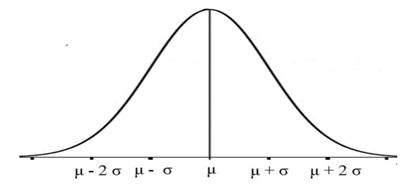
For finding the shape of the sampling distribution, use the Central Limit.
Thus, the shape of the sampling distribution of the sample mean is approximately normal.
For center, from the given information the mean of the sampling distribution of the sample mean
Thus, center equal to the mean
And for the spread, use the formula
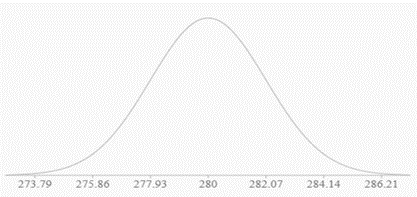
Thus, shape is approximately normal with mean 280 as center and the spread is the standard deviation which is equal 2.0702.
(b)
Todraw:The sampling distribution of the mean andmark three standard deviation value on each side of the mean.
(b)
Explanation of Solution
Given information:
Sample mean of the score = 280
Standard deviation = 60
Sample size of the people from the large population = 840
Sample mean
Standard deviation
Sample size = 840
Below figure shows the sampling distribution of
(c)
To calculate: The distance m of the mean of the sampling distribution.
(c)
Answer to Problem 5E
Distance m of the mean of the sampling distribution is 4.140.
Explanation of Solution
Given information:
Sample mean of the score = 280
Standard deviation = 60
Sample size of the people from the large population = 840
Calculation:
Sample mean
Standard deviation
Sample size = 840
Population standard deviation
The mean of the sampling distribution of the sample mean is
Find the standard deviation.
By 68-95-00.7% rule, about 95% of all values of
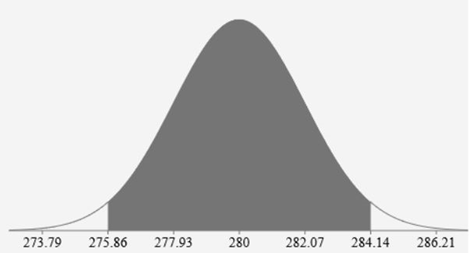
Hence, distance m of the mean of the sampling distribution is 4.140.
(d)
To calculate: The percent of all possible sample of
(d)
Answer to Problem 5E
Sample intervals capture 95% of
Explanation of Solution
Given information:
Sample mean of the score = 280
Standard deviation = 60
Sample size of the people from the large population = 840
Distance m of the mean of the sampling distribution.
95% of all values of
Hence,95% of all possible sample capture
Chapter 8 Solutions
The Practice of Statistics for AP - 4th Edition
Additional Math Textbook Solutions
Introductory Statistics (10th Edition)
Elementary Statistics Using Excel (6th Edition)
Introductory Statistics
Intro Stats, Books a la Carte Edition (5th Edition)


 MATLAB: An Introduction with ApplicationsStatisticsISBN:9781119256830Author:Amos GilatPublisher:John Wiley & Sons Inc
 Probability and Statistics for Engineering and th...StatisticsISBN:9781305251809Author:Jay L. DevorePublisher:Cengage Learning
 Statistics for The Behavioral Sciences (MindTap C...StatisticsISBN:9781305504912Author:Frederick J Gravetter, Larry B. WallnauPublisher:Cengage Learning
 Elementary Statistics: Picturing the World (7th E...StatisticsISBN:9780134683416Author:Ron Larson, Betsy FarberPublisher:PEARSON
 The Basic Practice of StatisticsStatisticsISBN:9781319042578Author:David S. Moore, William I. Notz, Michael A. FlignerPublisher:W. H. Freeman
 Introduction to the Practice of StatisticsStatisticsISBN:9781319013387Author:David S. Moore, George P. McCabe, Bruce A. CraigPublisher:W. H. Freeman