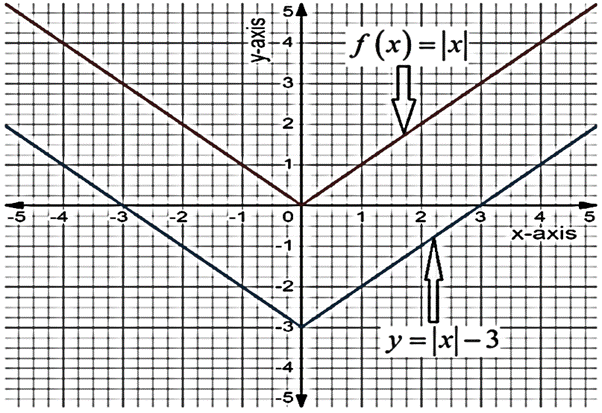
To graph: The function
Given:
The parent function is
Concept used:
The absolute value function
Graph:
Sketch the graph of the parent function

Interpretation:
From the graph of the function, it can be interpreted that the parent function
Chapter 8 Solutions
High School Math 2015 Common Core Algebra 2 Student Edition Grades 10/11
- adidas Samba OG X b Success Confirma ×☑Fall 2024 College X Untitled documen X Mind Tap - Cengaç X WA 6 Google Dc X Edpuzzle × b Home | bartleby × + → C Sarah ng.cengage.com/static/nb/ui/evo/index.html?elSBN=9780357046623&id=496670359&snapshotld=1198516& CENGAGE | MINDTAP EJ Update: Q Search this course HOME Є PROFILE ORDERS RENTALS COURSES Study Tools く « 4: Exponential and Logarithmic Functions College Success Tips Career Success Tips ? Help → SIGN OUT !!! A-Zarrow_forwardReintroduction of Wolves into Yellowstone National Park, Wyoming. The reintroduction of wolves to Yellowstone National Park is a fascinating case study in ecosys- tem management and conservation biology. Here's a brief overview of key aspects of this case: In 1995, wolves were reintroduced to Yellowstone National Park after being eliminated in the 1920s. The primary goal was to restore a vital part of the park's ecosystem that had been missing for nearly 70 years. The initial reintroduction involved 31 wolves from Canada. These wolves were released in sev- eral groups, and their populations grew steadily, benefiting from the abundant prey and lack of human interference. The reintroduction of wolves had profound effects on the Yellowstone ecosystem which are nicely summarized in this interesting (and somewhat controversial) video How Wolves Change Rivers While the Lotka-Volterra model simplifies complex ecological interactions, it provides a useful framework for understanding…arrow_forward2. Part II Real World Examples. Pesticides Pesticides that kill all insect species are not only bad for the environment, they can also be inefficient at controlling the pest species and can have unintended consequences. Suppose a pest insect species in a particular field has a population x(t) at a particular time t, and suppose its primary predator is another insect species with population y(t) at time t. Suppose the population of these species are accurately modeled by the system dx = 2.4x 1.2xy dt dy = −y+0.9xy dt Also suppose that at time t = 0 a pesticide is applied to the field that reduces both the pest and predator populations to a very small but non-zero numbers. 1. Use the Slopes app (or other similar app) to investigate what happens to this system. Choose 2 sets of initial conditions, both near zero. Let x(0) = 5y(0). Whatever initial values you choose for your first set, the second set of values should be 1/100 of the first. Plot the solutions. Be sure to expand the scale if…arrow_forward
- 1. PART I: Investigating Key Concepts Using Graphs. Although the Lotka-Volterra system can be solved analytically, the solutions are beyond the scope of our class, so we will will explore key concepts such as Cyclic Behavior, Parameter Sensitivity and Equilibrium Points and other features of the Lotka-Volterra predator-prey model graphically by using the Slopes App by Tim Lucas. You can use any other app or program to graph the solutions of the predator-prey system, but the Slopes App is really convenient. Cyclic Behavior: The model predicts that predator and prey populations can exhibit cyclic or oscillatory behavior over time. When the prey population is high, it provides abundant food for predators, causing the predator population to increase. As the predator population increases, it exerts greater predation pressure on the prey, causing the prey population to decline. This, in turn, leads to a decrease in the predator population due to reduced food availability. The cycle then…arrow_forwardEquilibrium Points: The model has equilibrium points where both populations remain constant over time. These equilibrium points can be stable or unstable, depending on the values of the model parameters. A stable equilibrium represents a situation where predator and prey popula- tions coexist in a relatively stable manner. In the Lotka-Volterra Model it is rare to find perfect equilibrium solutions, more often the solutions exhibit oscillatory behaviour around the equilibrium points rather than staying at them. To find the equilibrium points for this system we set both dx/dt and dy/dt to zero and solve dx = ax - bxy dt dy dt == -cy + dxy We find we have 2 sets of equilibrium values, (0,0) when both predator and prey populations vanish, and (c/d, a/b) when there are just enough prey to support a constant predator population but there are not too many predators. Answer the following question for the system shown below. dx dt = 2.4x-1.2xy 33 dy dt = −y + xy 11. Find the equilibrium values…arrow_forwardlogab(x) = 1/4 , logbc(x) =1/3 , logabc(x) =1/6 are given. What is logb(x)arrow_forward
 Algebra and Trigonometry (6th Edition)AlgebraISBN:9780134463216Author:Robert F. BlitzerPublisher:PEARSON
 Contemporary Abstract AlgebraAlgebraISBN:9781305657960Author:Joseph GallianPublisher:Cengage Learning
 Linear Algebra: A Modern IntroductionAlgebraISBN:9781285463247Author:David PoolePublisher:Cengage Learning
 Algebra And Trigonometry (11th Edition)AlgebraISBN:9780135163078Author:Michael SullivanPublisher:PEARSON
 Introduction to Linear Algebra, Fifth EditionAlgebraISBN:9780980232776Author:Gilbert StrangPublisher:Wellesley-Cambridge Press
 College Algebra (Collegiate Math)AlgebraISBN:9780077836344Author:Julie Miller, Donna GerkenPublisher:McGraw-Hill Education


