
a.
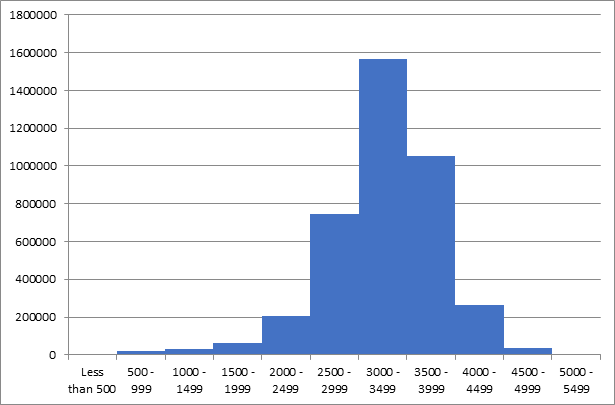
To find: histogram of the given data and also plot the relative frequencies and explain the distribution of weights of newborn babies.
a.
Explanation of Solution
Given:
The dataset:
| Weight(Grams) | Count |
| Less than 500 | 5980 |
| 500 - 999 | 22015 |
| 1000 - 1499 | 29846 |
| 1500 - 1999 | 63427 |
| 2000 - 2499 | 204295 |
| 2500 - 2999 | 744181 |
| 3000 - 3499 | 1566755 |
| 3500 - 3999 | 1055004 |
| 4000 - 4499 | 262997 |
| 4500 - 4999 | 36706 |
| 5000 - 5499 | 4216 |
Formula used:
Calculation:
| Weight(Grams) | Relative frequency |
| Less than 500 | 0.001 |
| 500 - 999 | 0.006 |
| 1000 - 1499 | 0.007 |
| 1500 - 1999 | 0.016 |
| 2000 - 2499 | 0.051 |
| 2500 - 2999 | 0.186 |
| 3000 - 3499 | 0.392 |
| 3500 - 3999 | 0.264 |
| 4000 - 4499 | 0.066 |
| 4500 - 4999 | 0.009 |
| 5000 - 5499 | 0.001 |
| Sum | 1 |
Graph:
The histogram:
The relative frequency histogram:
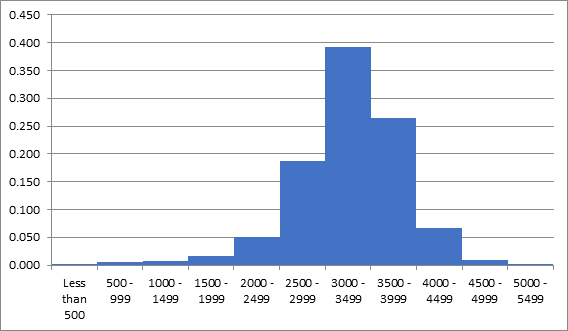
Based on the above histogram, it looks that data is approximately
b.
To find the median class of the data.
b.
Explanation of Solution
Formula used:
Calculation:
| Weight(Grams) | Count | Cumulative frequency. |
| Less than 500 | 5980 | 5980 |
| 500 - 999 | 22015 | 27995 |
| 1000 - 1499 | 29846 | 57841 |
| 1500 - 1999 | 63427 | 121268 |
| 2000 - 2499 | 204295 | 325563 |
| 2500 - 2999 | 744181 | 1069744 |
| 3000 - 3499 | 1566755 | 2636499 |
| 3500 - 3999 | 1055004 | 3691503 |
| 4000 - 4499 | 262997 | 3954500 |
| 4500 - 4999 | 36706 | 3991206 |
| 5000 - 5499 | 4216 | 3995422 |
| Sum | 3995422 |
Median =
Now, it required to see that in under which CF value does it falls.
The value 1997711 is less than 2636499, so the median value falls in the class 3000 − 3499.
c.
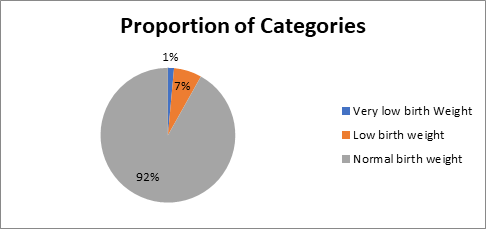
To construct the pie chart or bar chart to show the proportion of given categories.
c.
Explanation of Solution
Given:
The categories:
Very low birth weight: Less than 1500 grams
Low birth weight: Less than 2500 grams
Normal birth weight: More than 2500 grams
Calculation:
Count of each category:
| Category | Frequency | Proportion |
| Very low birth Weight | 57841 | 0.0144768 |
| Low birth weight | 267722 | 0.0670072 |
| Normal birth weight | 3669859 | 0.918516 |
Graph:
d.
To explain the outcome of the analysis that is being done so far.
d.
Explanation of Solution
Based on the graph prepared in the last part, it is clearly visible that about 8% child having risk of low weight at the time of birth, which indicates at huge proportion of total, it is not an unusual
Want to see more full solutions like this?
Chapter 8 Solutions
Practice of Statistics in the Life Sciences

 MATLAB: An Introduction with ApplicationsStatisticsISBN:9781119256830Author:Amos GilatPublisher:John Wiley & Sons Inc
 Probability and Statistics for Engineering and th...StatisticsISBN:9781305251809Author:Jay L. DevorePublisher:Cengage Learning
 Statistics for The Behavioral Sciences (MindTap C...StatisticsISBN:9781305504912Author:Frederick J Gravetter, Larry B. WallnauPublisher:Cengage Learning
 Elementary Statistics: Picturing the World (7th E...StatisticsISBN:9780134683416Author:Ron Larson, Betsy FarberPublisher:PEARSON
 The Basic Practice of StatisticsStatisticsISBN:9781319042578Author:David S. Moore, William I. Notz, Michael A. FlignerPublisher:W. H. Freeman
 Introduction to the Practice of StatisticsStatisticsISBN:9781319013387Author:David S. Moore, George P. McCabe, Bruce A. CraigPublisher:W. H. Freeman