
Concept explainers
Videos
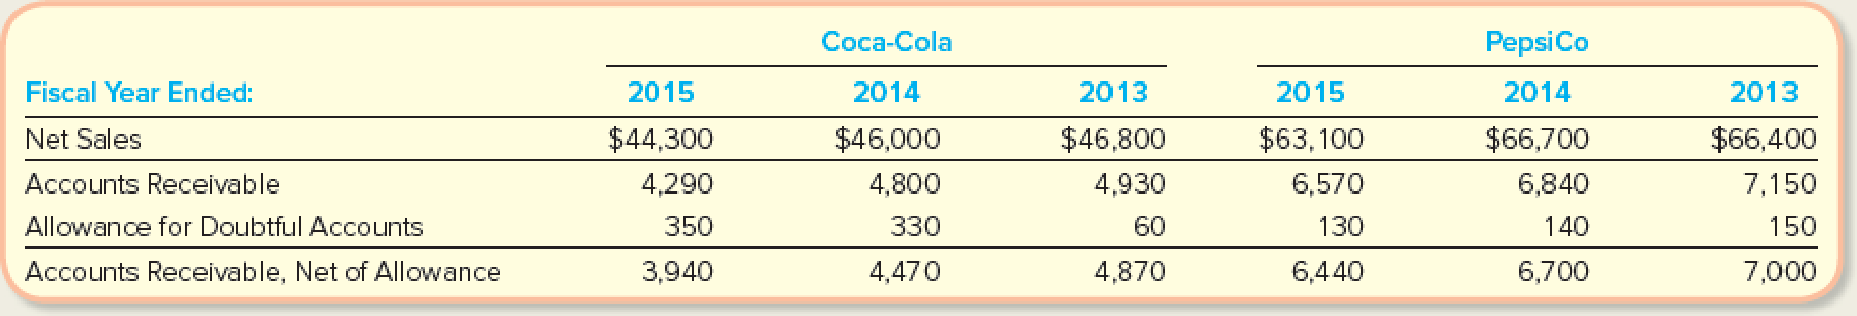
Analyzing Allowance for Doubtful
Coca-Cola and PepsiCo are two of the largest and most successful beverage companies in the world in terms of the products that they sell and their receivables management practices. To evaluate their ability to collect on credit sales, consider the following rounded amounts reported in their annual reports (amounts in millions).
Required:
- 1. Calculate the receivables turnover ratios and days to collect for Coca-Cola and PepsiCo for 2015 and 2014. (Round to one decimal place.)
- 2. Which of the companies is quicker to convert its receivables into cash?
1.
Calculate the receivables turnover ratio and days to collect of Company C and Company P for 2015 and 2014.
Explanation of Solution
Accounts receivable turnover: This is the ratio which analyzes the number of times accounts receivables is collected and converted into cash during the period. This ratio gauges the efficacy of collecting receivables. The more times the ratio indicates the more efficient in collecting receivables.
Average days to collect accounts receivable (average collection period): This ratio measures the number of times receivables are collected in the period. This ratio analyzes the period receivables are outstanding. So, this ratio also gauges the efficacy of collecting receivables. Lower the ratio, more efficient the collection of receivables.
Calculate accounts receivables turnover ratio and days to collect for Company C for 2015 as follows:
Thus, the accounts receivables turnover ratio and the number of days to collect the receivables for Company C for the year 2015 are 10.53 times and 34.66 days respectively.
Calculate accounts receivables turnover ratio and days to collect for Company C for 2014 as follows:
Thus, the accounts receivables turnover ratio and the number of days to collect the receivables for Company C for the year 2014 are 9.9 times and 36.9 days respectively.
Calculate accounts receivables turnover ratio and days to collect for Company P for 2015 as follows:
Thus, the accounts receivables turnover ratio and the number of days to collect the receivables for Company P for the year 2015 are 9.6 times and 38 days respectively.
Calculate accounts receivables turnover ratio and days to collect for Company P for 2014 as follows:
Thus, the accounts receivables turnover ratio and the number of days to collect the receivables for Company P for the year 2014 are 9.7 times and 37.63 days respectively.
2.
Identify the company which has quicker ability to convert its receivables into cash in 2015 and 2014.
Explanation of Solution
Identify the company which has quicker ability to convert its receivables into cash in 2015 and 2014.
| Particulars | Company C | Company P | ||
| 2014 | 2015 | 2014 | 2015 | |
| Receivable turnover ratio | 9.9 times | 10.5 times | 9.7 times | 9.6 times |
| Days to collect ratio | 36.9 days | 34.6 days | 37.6 days | 38 days |
Table (1)
A company which has higher receivables turnover ratio and lower days to collect the receivables is considered as the best company in converting its receivables to cash.
In 2014, Company C’s receivables turnover ratio is higher and days to collect is lower in comparison with Company P.
In 2015, Company C’s receivables turnover ratio is higher and days to collect is lower in comparison with Company P.
Therefore, Company C has the quicker ability to convert its receivables into cash in both the years.
Want to see more full solutions like this?
Chapter 8 Solutions
FUNDAMENTALS OF FINANCIAL ACCOUNTING


- ed Softee Sodas and Patterson Beverage Company are two of the largest and most successful beverage companies in the world in terms of the products that they sell and their receivables management practices. To evaluate their ability to collect on credit sales, consider the following rounded amounts reported in their annual reports (amounts in millions). Fiscal Year Ended: Net Sales Accounts Receivable Allowance for Doubtful Accounts Accounts Receivable, Net of Allowance 2018 $ 35,660 4,130 550 3,580 Softee Sodas 2017 $ 39,520 4,390 540 3,850 Patterson Beverage Company 2016 $ 44,440 4,580 530 4,050 2018 $ 71,440 7,680 100 7,580 2017 $ 72,120 7,590 130 2016 $ 66,660 7,250 140 7,460 7,110 Required: 1. Calculate the receivables turnover ratios and days to collect for Softee Sodas and Patterson Beverage Company for 2018 and 2017. 2-a. Which of the companies was quicker to convert its receivables into cash in 2018? 2-b. Which of the companies was quicker to convert its receivables into cash…arrow_forwardSoftee Sodas and Patterson Beverage Company are two of the largest and most successful beverage companies in the world in terms of the products that they sell and their receivables management practices. To evaluate their ability to collect on credit sales, consider the following rounded amounts reported in their annual reports (amounts in millions). Softee Sodas Patterson Beverage Company Fiscal Year Ended: 2018 2017 2016 2018 2017 2016 Net Sales $ 42,160 $ 46,840 $ 48,600 $ 85,696 $ 86,240 $ 72,900 Accounts Receivable 4,490 4,810 5,030 8,400 8,310 7,930 Allowance for Doubtful Accounts 640 630 620 100 130 140 Accounts Receivable, Net of Allowance 3,850 4,180 4,410 8,300 8,180 7,790 Required: 1. Calculate the receivables turnover ratios and days to collect for Softee Sodas and Patterson Beverage Company for 2018 and 2017. 2-a. Which of the companies was quicker to convert its receivables into cash in 2018? 2-b. Which of the companies was quicker to convert its receivables into cash in…arrow_forwardFiscal Year Ended: Net Sales Coca-Cola PepsiCo Accounts Receivable Allowance for Doubtful Accounts Accounts Receivable, Net of Allowance PAS-5 Analyzing Allowance for Doubtful Accounts, Receivables Turnover Ratio, and Days to Collect Coca-Cola and PepsiCo are two of the largest and most successful beverage companies in the world in terms of the products that they sell and their receivables management practices. To evalu- ate their ability to collect on credit sales, consider the following rounded amounts reported in their annual reports (amounts in millions). 1. Coca-Cola 20180S 2017 $35,410 4,150 480 3,670 $31,860 3,890 490 3,400 2016 $41,860 4,330 470 3,860 2018 $64,660 7,240 100 7,140 bylinePepsiCo 6901 2017 $63,525 7,155 130 7,025 LOM 2016 $62,800 6,835 135 6,700 Required: bris 02 snut no 12575 in low M23 sin temos rytą legioning baa lassani o or lam liv M23 vatno smo se sas Calculate the receivables turnover ratios and days to collect for Coca-Cola and PepsiCo for 2018 and 2017.…arrow_forward
- Assume selected financial data for Walmart and Target, two close competitors in the retail industry, are as follows: Net Beginning Accounts Ending Accounts ($ in millions) Sales Receivable Receivable $463,854 79,466 $6,064 6,653 $6,937 6,427 Walmart Target Required: 1-a. Calculate the receivables turnover ratio and average collection period for Walmart and Target. (Enter your answers in millions. Do not round your intermediate calculations and round your answers to 1 decimal place.) Receivables Turnover Ratio Receivables Turnover Ratio Walmart times %3D Target 0 times %3D Average Collection Period Average Collection Period %3D Walmart 0 days Target 0 days 1-b. Which company maintains a higher receivables turnover? Walmart Target II II II IIarrow_forwardThe following data are for Rocky Company. Accounts receivable, net Net sales Current Year $ 153,400 861,105 1 Year Ago $ 138,500 910, 600 (a) Compute Rocky's accounts receivable turnover. (b) If its competitor, Dixon, has an accounts receivable turnover of 7.5, which company appears to be doing a better job of managing its receivables?arrow_forwardCola Inc. and Soda Co. are two of the largest and most successful beverage companies in the world in terms of the products that they sell and their receivables management practices. To evaluate their ability to collect on credit sales, consider the following rounded amounts reported in their annual reports (amounts in millions). Cola Inc. Soda Co. Fiscal Year Ended: 2015 2014 2013 2015 2014 2013 Net Sales $ 31,219 $ 26,690 $ 27,944 $ 53,448 $ 39,232 $ 39,251 Accounts Receivable 4,398 3,733 3,061 6,387 4,634 3,704 Allowance for Doubtful Accounts 40 47 43 136 82 62 Accounts Receivable, Net of Allowance 4,358 3,686 3,018 6,251 4,552 3,642 Required: Calculate the receivables turnover ratios and days to collect for Cola Inc. and Soda Co. for 2015 and 2014. (Use 365 days in a year. Do not round intermediate calculations on Accounts Receivable Turnover Ratio. Round…arrow_forward
- a) Calculate Kopitiam Sdn Bud’s accounts receivable turnover ratio for Year 2 and Year 3. b) Calculate the number of days the average balance of receivables is outstanding before being converted into cash (turnover in days) for Year 2 and Year 3 c) What problem do you see with the company’s credit policy if the terms are net 30 days? Explain your answer.arrow_forwardThe following data are for Rocky Company. Current Year 1 Year Ago Accounts receivable, net $ 156,800 $ 141,900 Net sales 1,031,105 1,080,600 (a) Compute Rocky's accounts receivable turnover. (b) If its competitor, Dixon, has an accounts receivable turnover of 9, which company appears to be doing a better job of managing its receivables?arrow_forwardYou are an investor looking to contribute financially to either company A or Company B. The following, select financial information as follows. Company A and company B, respectively: Beginning Account Receivable $ 50,000, 60,000; Ending Account Receivable $ 80,000, 90,000; Net credit sales $ 550,000, $460,000. Based on the information provided: compute the account receivable turnover ratio. Compute the number of days sales in receivables ratio for both companies A and company B ( round all answers to two decimals places) Interpret the outcomes stating which company you would invest in and why.arrow_forward
- A company regularly sells its receivables to a factor who assesses a 2% service charge on the amount of receivables purchased. Which of the following statements is true for the seller of the receivables? The credit to Accounts Receivable is less than the debit to Cash when the accounts are sold. Selling expenses will increase each time accounts are sold. The other expense section of the income statement will increase each time accounts are sold. The loss section of the income statement will increase each time receivables are sold.arrow_forwardThe following information is from the annual financial statements of Raheem Company, Year 2 $ 335,280 41,400 Net sales Accounts receivable, net (year-end) (1) Compute its accounts receivable turnover for Year 2 and Year 3. (2) Assuming its competitor has a turnover of 11, is Raheem performing better or worse at collecting receivables than its competitor? Complete this question by entering your answers in the tabs below. Year 3 $ 405,140 44,800 Required 1 Required 2 Compute its accounts receivable turnover for Year 2 and Year 3. Year 2: Year 3: Choose Numerator: Accounts Receivable Turnover Choose Denominator 7 1 1 Year 1 $ 388,000 34,800 W Accounts Receivable Turnover. Accounts receivable tumover times timesarrow_forwardUse the following financial statement information from Black Water Industries. BLACK WATER INDUSTRIES Ending Accounts Receivable Year Net Credit Sales 2017 $690,430 $335,250 2018 705,290 364,450 2019 770,500 406,650 A. Compute the accounts receivable turnover ratios for 2018 and 2019. Round your answers to two decimal places. 2018 times 2019 times B. Using the accounts receivable turnover, choose the statement that most closely describes the company's management of its receivables. a. The company's lending policies may be too strict. b. Collection efforts are not aggressive enough. There may be uncollectable receivables affecting the beginning and ending C. balances. d. All of the above statements may be correct. a b darrow_forward
 Managerial AccountingAccountingISBN:9781337912020Author:Carl Warren, Ph.d. Cma William B. TaylerPublisher:South-Western College Pub
 Principles of Accounting Volume 1AccountingISBN:9781947172685Author:OpenStaxPublisher:OpenStax College
 Financial Accounting: The Impact on Decision Make...AccountingISBN:9781305654174Author:Gary A. Porter, Curtis L. NortonPublisher:Cengage Learning