
Videos
(a)
To create a
(a)
Explanation of Solution
In the question we are examining the association between the fat and calories in fast-food hamburgers. Thus, provided the data on the fat and calories, the scatterplot of fat versus calories is given as:
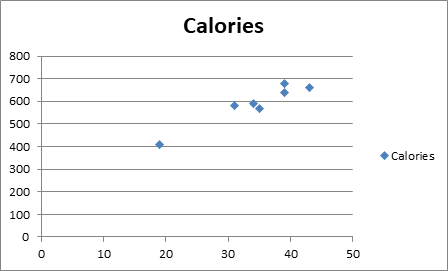
In the above scatterplot we can see that the fat is on the horizontal axis and the calories is on the vertical axis. From the points in the scatterplot we can say that the points are in the upward direction thus the relationship must be positive in nature. And the association between the fat and the calories must be strong and linear in nature.
(b)
To interpret the value of
(b)
Answer to Problem 45E
The value of
Explanation of Solution
In the question we are examining the association between the fat and calories in fast-food hamburgers. Thus, the data is as below:
| Fat | Calories |
| 19 | 410 |
| 31 | 580 |
| 34 | 590 |
| 35 | 570 |
| 39 | 640 |
| 39 | 680 |
| 43 | 660 |
Now for calculating the value of
Thus, the calculation is as follows:
| Correlation = | =CORREL(D64:D70,E64:E70) |
And the result will be as follows:
| Correlation = | 0.9606 |
Now, the value of
Thus, we can interpret that
(c)
To write the equation of the line of regression.
(c)
Answer to Problem 45E
Explanation of Solution
In the question we are examining the association between the fat and calories in fast-food hamburgers. Thus, the data is as below:
| Fat | Calories |
| 19 | 410 |
| 31 | 580 |
| 34 | 590 |
| 35 | 570 |
| 39 | 640 |
| 39 | 680 |
| 43 | 660 |
Now, the equation of the regression can be calculated by using the excel. Thus, we have,
Formula used:
The formula for mean is as:
And the formula for the standard deviation is as:
Calculation:
The mean, standard deviation and correlation is calculated as:
For the mean,
| Fat | Calories | |
| Average = | =AVERAGE(D64:D70) | =AVERAGE(E64:E70) |
For the standard deviation,
| Fat | Calories | |
| Standard deviation = | =STDEV(D64:D70) | =STDEV(E64:E70) |
Thus, the result is as:
| Fat | Calories | |
| Average = | 34 | 590 |
| Fat | Calories | |
| Standard deviation = | 7.80 | 89.81 |
So, we have,
The value of correlation is taken from the part (b), thus the regression equation can be calculated as:
(d)
To use the residual plot to explain whether your linear model is appropriate.
(d)
Answer to Problem 45E
Yes, linear model is appropriate.
Explanation of Solution
In the question we are examining the association between the fat and calories in fast-food hamburgers. Thus, the data is as below:
| Fat | Calories |
| 19 | 410 |
| 31 | 580 |
| 34 | 590 |
| 35 | 570 |
| 39 | 640 |
| 39 | 680 |
| 43 | 660 |
Also, it is given that,
And the regression line is:
Thus, the residual plot is as follows:
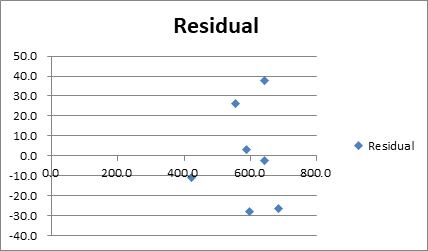
Thus, from the residual plot we can see that the residual shows no clear points as the points are in different direction so, we can conclude that the model seems appropriate by concluding from the residual plot.
(e)
To explain the meaning of the y -intercept of the line.
(e)
Explanation of Solution
In the question we are examining the association between the fat and calories in fast-food hamburgers. Thus, the data is as below:
| Fat | Calories |
| 19 | 410 |
| 31 | 580 |
| 34 | 590 |
| 35 | 570 |
| 39 | 640 |
| 39 | 680 |
| 43 | 660 |
Also, it is given that,
And the regression line is:
Thus, the y -intercept interprets that we can say that a fat-free burger still has
(f)
To explain the meaning of the slope of the line.
(f)
Explanation of Solution
In the question we are examining the association between the fat and calories in fast-food hamburgers. Thus, the data is as below:
| Fat | Calories |
| 19 | 410 |
| 31 | 580 |
| 34 | 590 |
| 35 | 570 |
| 39 | 640 |
| 39 | 680 |
| 43 | 660 |
Also, it is given that,
And the regression line is:
Thus, the slope of the line explains that every gram of fat adds to
(g)
To find out how many calories does the burger have.
(g)
Answer to Problem 45E
The new burger has
Explanation of Solution
In the question we are examining the association between the fat and calories in fast-food hamburgers. Thus, the data is as below:
| Fat | Calories |
| 19 | 410 |
| 31 | 580 |
| 34 | 590 |
| 35 | 570 |
| 39 | 640 |
| 39 | 680 |
| 43 | 660 |
Also, it is given that,
And the regression line is:
It is given that a new burger containing
Thus, the actual calories that the burger have is:
Thus, the new burger has
Chapter 8 Solutions
Stats: Modeling the World Nasta Edition Grades 9-12
Additional Math Textbook Solutions
Statistics for Business and Economics (13th Edition)
STATS:DATA+MODELS-W/DVD
Statistics: The Art and Science of Learning from Data (4th Edition)
Basic Business Statistics, Student Value Edition


 MATLAB: An Introduction with ApplicationsStatisticsISBN:9781119256830Author:Amos GilatPublisher:John Wiley & Sons Inc
 Probability and Statistics for Engineering and th...StatisticsISBN:9781305251809Author:Jay L. DevorePublisher:Cengage Learning
 Statistics for The Behavioral Sciences (MindTap C...StatisticsISBN:9781305504912Author:Frederick J Gravetter, Larry B. WallnauPublisher:Cengage Learning
 Elementary Statistics: Picturing the World (7th E...StatisticsISBN:9780134683416Author:Ron Larson, Betsy FarberPublisher:PEARSON
 The Basic Practice of StatisticsStatisticsISBN:9781319042578Author:David S. Moore, William I. Notz, Michael A. FlignerPublisher:W. H. Freeman
 Introduction to the Practice of StatisticsStatisticsISBN:9781319013387Author:David S. Moore, George P. McCabe, Bruce A. CraigPublisher:W. H. Freeman