
Concept explainers
Videos
The Data Bank is found in Appendix B, or on the World Wide Web by following links from www.mhhe.com/math/stats/bluman/
1. From the Data Bank, select a random sample of at least 30 individuals, and test one or more of the following hypotheses by using the z test. Use α = 0.05.
a. For serum cholesterol, H0: μ = 220 milligram percent (mg%). Use σ = 5.
b. For systolic pressure, H0: μ = 120 millimeters of mercury (mm Hg). Use σ = 13.
c. For IQ, H0: μ = 100. Use σ = 15.
d. For sodium level, H0: μ = 140 milliequivalents per liter (mEq/l). Use σ = 6.
a.
To test: The claim that
Answer to Problem 1DA
The conclusion is that there is sufficient evidence to infer that the average serum cholesterol level is differs from 220 milligram percent (mg%).
Explanation of Solution
Answer will vary. One of the possible answers is given below:
Given info:
Claim:
Calculation:
State the null and alternative hypotheses:
Null hypothesis:
Alternative hypothesis:
Test statistic value and P-value:
Software procedure:
Step by step procedure to obtain the test value using the MINITAB software:
- Choose Stat > Basic Statistics > 1-Sample Z.
- In Samples in Column, enter the column of Serum cholesterol.
- In Standard deviation, enter 5.
- In Perform hypothesis test, enter the test mean as 220.
- Check Options; enter Confidence level as 95%.
- Choose not equal in alternative.
- Click OK in all dialogue boxes.
Output using the MINITAB software is given below:
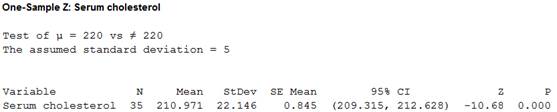
From the output, the test value is –10.68 and the P-value is 0.000.
Make the Decision:
Decision rule:
If
If
Here, the P-value is lesser than the level of significance.
That is,
By the decision rule, the null hypothesis is rejected.
Thus, the decision is “reject the null hypothesis”.
Summarize the result:
There is sufficient evidence to infer that the average serum cholesterol level is differs from 220 milligram percent (mg%).
b.
To test: The claim that
Answer to Problem 1DA
The conclusion is that there is sufficient evidence to infer that the average systolic pressure is differs from 120 millimeters of mercury (mm Hg).
Explanation of Solution
Given info:
Claim:
Calculation:
State the null and alternative hypotheses:
Null hypothesis:
Alternative hypothesis:
Test statistic value and P-value:
Software procedure:
Step by step procedure to obtain the test value using the MINITAB software:
- Choose Stat > Basic Statistics > 1-Sample Z.
- In Samples in Column, enter the column of Systolic pressure.
- In Standard deviation, enter 13.
- In Perform hypothesis test, enter the test mean as 120.
- Check Options; enter Confidence level as 95%.
- Choose not equal in alternative.
- Click OK in all dialogue boxes.
Output using the MINITAB software is given below:
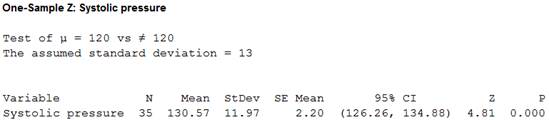
From the output, the test value is 4.81 and the P-value is 0.000.
Make the Decision:
Here, the P-value is lesser than the level of significance.
That is,
By the decision rule, the null hypothesis is rejected.
Thus, the decision is “reject the null hypothesis”.
Summarize the result:
There is sufficient evidence to infer that the average systolic pressure is differs from 120 millimetres of mercury (mm Hg).
c.
To test: The claim that
Answer to Problem 1DA
The conclusion is that there is sufficient evidence to infer that the average IQ score is differs from 100.
Explanation of Solution
Given info:
Claim:
Calculation:
State the null and alternative hypotheses:
Null hypothesis:
Alternative hypothesis:
Test statistic value and P-value:
Software procedure:
Step by step procedure to obtain the test value using the MINITAB software:
- Choose Stat > Basic Statistics > 1-Sample Z.
- In Samples in Column, enter the column of IQ.
- In Standard deviation, enter 15.
- In Perform hypothesis test, enter the test mean as 100.
- Check Options; enter Confidence level as 95%.
- Choose not equal in alternative.
- Click OK in all dialogue boxes.
Output using the MINITAB software is given below:
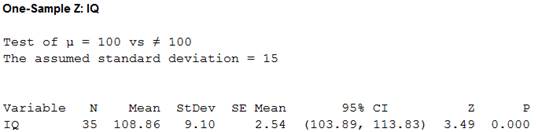
From the output, the test value is 3.49 and the P-value is 0.000.
Make the Decision:
Here, the P-value is lesser than the level of significance.
That is,
By the decision rule, the null hypothesis is rejected.
Thus, the decision is “reject the null hypothesis”.
Summarize the result:
There is sufficient evidence to infer that the average IQ score is differs from 100.
d.
To test: The claim that
Answer to Problem 1DA
The conclusion is that there is sufficient evidence to infer that the average sodium level is 140.
Explanation of Solution
Given info:
Claim:
Calculation:
State the null and alternative hypotheses:
Null hypothesis:
Alternative hypothesis:
Test statistic value and P-value:
Software procedure:
Step by step procedure to obtain the test value using the MINITAB software:
- Choose Stat > Basic Statistics > 1-Sample Z.
- In Samples in Column, enter the column of Sodium level.
- In Standard deviation, enter 6.
- In Perform hypothesis test, enter the test mean as 140.
- Check Options; enter Confidence level as 95%.
- Choose not equal in alternative.
- Click OK in all dialogue boxes.
Output using the MINITAB software is given below:
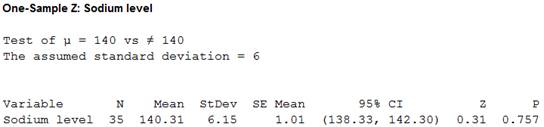
From the output, the test value is 0.31 and the P-value is 0.757.
Make the Decision:
Here, the P-value is greater than the level of significance.
That is,
By the decision rule, the null hypothesis is not rejected.
Thus, the decision is “fail to reject the null hypothesis”.
Summarize the result:
There is sufficient evidence to infer that the average sodium level is 140.
Want to see more full solutions like this?
Chapter 8 Solutions
Elementary Statistics: A Step By Step Approach
Additional Math Textbook Solutions
Statistics for Business and Economics (13th Edition)
Business Analytics
Introductory Statistics (10th Edition)
STATS:DATA+MODELS-W/DVD
Statistics Through Applications
Statistics: Informed Decisions Using Data (5th Edition)


- An electrical engineer wishes to determine if, among two specific municipal buildings in town, Building “North” and Building “South”, whether the tensile strength of pipes (in psi) is not the same in each of these two buildings. A sample of pipes was chosen at random from both Building “North” and Building “South”, respectively. Using α = 0.05, which of the following statistical test, or parameter, would be best for determining whether tensile strength of pipes (in psi) is not the same in each of these two buildings? (Assume all statistical assumptions met.) a) Binomial Distribution b) Population Difference in Means (i.e., Unpaired Data) c) The Chi-Squared Test of Independence d) Population Mean Difference (i.e., Paired Data)arrow_forwardA random sample of 10 professional athletes produced the following data where X is the number of endorsements the player has and Y is the amount of money made (in millions of dollars). Use the 4 steps of hypothesis testing to see if the prediction is significant with a criteria of alpha=.05 on the following data. x y 0 2 3 8 2 7 1 3 5 13 5 12 4 9 3 9 0 3 4 10arrow_forwardIn an article in the Journal of Advertising, Weinberger and Spotts compare the use of humor in television ads in the United States and in the United Kingdom. Suppose that independent random samples of television ads are taken in the two countries. A random sample of 400 television ads in the United Kingdom reveals that 142 use humor, while a random sample of 500 television ads in the United States reveals that 122 use humor. a) Set up the null and alternative hypotheses needed to determine whether the proportion of ads using humor in the United Kingdom differs from the proportion of ads using humor in the United States. b) Test the hypotheses you set up in part a by using critical values and by setting a equal to .10, .05, .01, and .001. How much evidence is there that the proportions of U.K. and U.S. ads using humor are different?. Please do this stepwise and explanation and also dont do handwritten or skip please!! I will like.arrow_forward
- You complete a hypothesis test using alpha = .05 and based on the evidence from the sample, your decision is to fail to reject the null hypothesis. If the treatment actually does have an effect, which of the following is true?arrow_forwardConsider the following: In general, when people diet they typically lose 10 lbs. (?σ = 2). A random sample of 16 people on the keto diet lost 15 lbs. Do people on the keto diet lose more or less weight than people on diets in general? 4. What is the research hypothesis? a) Weight loss in the keto diet sample does not differ from weight loss in the population of dieters in general (H1: X-bar = Mu) b)Weight loss in the keto diet sample does differ from weight loss in the population of dieters in general (H1: X-bar = Mu) c) Weight loss in the keto diet sample does not differ from weight loss in the population of dieters in general (H1: X-bar does not equal Mu) d) Weight loss in the keto diet sample does differ from weight loss in the population of dieters in general (H1: X-bar does not equal Mu)arrow_forwardThe National Institute of Mental Health published an article stating that in any two-year period, approximately 10.5percent of American adults suffer from depression or a depressive illness. Suppose that in a survey of 150 people in a certain town, eight of them suffered from depression or a depressive illness. If you were conducting a hypothesis test to determine if the true proportion of people in that town suffering from depression or a depressive illness is lower than the percent in the general adult American population, what would the null and alternative hypotheses be?arrow_forward
- what is measured by Cohen's d for a hypothesis test with a t statistic?arrow_forwardIn a completely randomized experimental design, three brands of paper towels were tested for their ability to absorb water. Equal-size towels were used, with four sections of towels tested per brand. The absorbency rating data follow. Brand x y z 91 100 82 100 96 89 89 95 89 88 93 80 #1) At a 0.05 level of significance, does there appear to be a difference in the ability of the brands to absorb water? State the null and alternative hypotheses: A) H0: ?x ≠ ?y ≠ ?zHa: ?x = ?y = ?z B) H0: ?x = ?y = ?zHa: ?x ≠ ?y ≠ ?z C) H0: At least two of the population means are equal.Ha: At least two of the population means are different. D) H0: ?x = ?y = ?zHa: Not all the population means are equal. E) H0: Not all the population means are equal.Ha: ?x = ?y = ?z #2) Find the value of the test statistic. (Round your answer to two decimal places.) Find the p-value. (Round your answer to three decimal places.) p-value = #3) State your conclusion. A) Reject H0. There is…arrow_forwardIn a completely randomized experimental design, three brands of paper towels were tested for their ability to absorb water. Equal-size towels were used, with four sections of towels tested per brand. The absorbency rating data follow. Brand x y z 91 100 82 100 96 89 89 95 89 88 93 80 #1) At a 0.05 level of significance, does there appear to be a difference in the ability of the brands to absorb water? State the null and alternative hypotheses: A) H0: ?x ≠ ?y ≠ ?zHa: ?x = ?y = ?z B) H0: ?x = ?y = ?zHa: ?x ≠ ?y ≠ ?z C) H0: At least two of the population means are equal.Ha: At least two of the population means are different. D) H0: ?x = ?y = ?zHa: Not all the population means are equal. E) H0: Not all the population means are equal.Ha: ?x = ?y = ?z #2) Find the value of the test statistic. (Round your answer to two decimal places.) Find the p-value. (Round your answer to three decimal places.) p-value = #3) State your conclusion. A) Reject H0. There is…arrow_forward
- Also, using α = .05, run a two-tail t-test for one sample to test Ho: µ=283 for the 2009 scores. Report the t-obt, df, and p-values. Would you reject the null hypothesis that the 2009 scores come from a population with average 283? If this is the case, does it come from a population from larger or smaller average?arrow_forwardBased on information from a previous study, r1 = 38 people out of a random sample of n1 = 104 adult Americans who did not attend college believe in extraterrestrials. However, out of a random sample of n2 = 104 adult Americans who did attend college, r2 = 48 claim that they believe in extraterrestrials. Does this indicate that the proportion of people who attended college and who believe in extraterrestrials is higher than the proportion who did not attend college? Use ? = 0.01. (a) What is the level of significance?State the null and alternate hypotheses. H0: p1 = p2; H1: p1 > p2H0: p1 = p2; H1: p1 < p2 H0: p1 = p2; H1: p1 ≠ p2H0: p1 < p2; H1: p1 = p2 (b) What sampling distribution will you use? What assumptions are you making? The Student's t. The number of trials is sufficiently large.The standard normal. The number of trials is sufficiently large. The Student's t. We assume the population distributions are approximately normal.The standard normal. We assume the…arrow_forwardBased on information from a previous study, r1 = 38 people out of a random sample of n1 = 105 adult Americans who did not attend college believe in extraterrestrials. However, out of a random sample of n2 = 105 adult Americans who did attend college, r2 = 49 claim that they believe in extraterrestrials. Does this indicate that the proportion of people who attended college and who believe in extraterrestrials is higher than the proportion who did not attend college? Use α = 0.01. 1. What is the value of the sample test statistic? (Test the difference p1 − p2. Do not use rounded values. Round your final answer to two decimal places.) 2. Find (or estimate) the P-value. (Round your answer to four decimal places.)arrow_forward
 Holt Mcdougal Larson Pre-algebra: Student Edition...AlgebraISBN:9780547587776Author:HOLT MCDOUGALPublisher:HOLT MCDOUGAL