Videos
Regression Line
Program plan:
- Import the header file.
- Define the “graphWin” method
- Create a window
- Set the coords
- Display the message on the window
- Call the “draw” method for set the point
- Call the “Line” method for draw the line
- Call the “draw” method for set the point
- Call the “Line” method for draw the line
- Call the “draw” method
- Call the “Rectangle” method
- Get the center position
- Set the “Done” text
- Call the “draw” method stop the program after clicking the “Done” text
- Accept the input from the user
- Set the list
- Make the condition true
- Get the mouse action
- Check the condition
- Break the loop
- Otherwise, store user points in an appended list
- Call the “draw” method
- Return the result
- Define the “average” method
- Set the values for the variables
- Iterate “i” until it reaches “allPoints” value
- Get the “x” and “y” value
- Calculate “sumX”, and “sumY”
- Increment the “count” value
- Calculate the “sumXiYi, “sqX”, “sumSqXi”, “SqY”, and sumSqYi” values
- Calculate the “a” and “b” values
- Return the values
- Define “main” method
- Display the text on the window
- Call the “average” method
- Set the values
- Call the “Line” method
- Call the “draw” method
- Get the mouse action
- Call the function “main()”.
Explanation of Solution
Program:
#import the required header files
from graphics import *
import math as m
#definition of "graphWin" method
def graphWin(Title):
#Create a graphics window
win = GraphWin(Title, 400, 400)
#set the coords
win.setCoords(-10, -10, 10, 10)
#tell user to select multiple locations on the screen to designate points
message = Text(Point(-3, 8), "Click to delineate points on the graph.")
#draw the point
message.draw(win)
#call the "Line" method
axisX = Line(Point(-10,0), Point(10,0))
#call the "draw" method
axisX.draw(win)
#call the "Line" method
axisY = Line(Point(0,10), Point(0,-10))
#call the "draw" method
axisY.draw(win)
#call the "Rectangle" method
r = Rectangle(Point(-9, -9), Point(-7,-8))
#call the "draw" method
r.draw(win)
#get the centre position
rCenter = r.getCenter()
#set the text
stopMouse = Text(rCenter, "Done")
#call the "draw" method
stopMouse.draw(win)
#accept input from user until <done> button is pressed
click = Point(0,0)
#set the list
allPoints = []
#check the condition
while True:
#get the mouse action
click = win.getMouse()
#check the condition
if ((-9 <= click.getX() <= -7) and (-9 <= click.getY() <= -8)):
#break the loop
break
#otherwise
else:
#store user points in an appended list
allPoints.append(click)
#call the "draw" method
click.draw(win)
#return the values
return allPoints, win
#definition of "average" method
def average(allPoints):
#set the values for the variables
sumX = 0
sumY = 0
count = 0
sumXiYi = 0
sumSqXi = 0
sumSqYi = 0
#iterate "i" until it reaches "allPoints" value
for i in allPoints:
#get the "x" and "y" value
x = i.getX()
y = i.getY()
#calculate the "sumX" value
sumX = sumX + x
#calculate the "sumY" value
sumY = sumY + y
#increment the value
count = count + 1
#calculate the "xy" value
xy = x * y
#calculate the "sumXiYi" value
sumXiYi = sumXiYi + xy
#calculate the "SqX" value
SqX = x * x
#calculate the "sumSqXi" value
sumSqXi = sumSqXi + SqX
#calculate the "SqY" value
SqY = y * y
#calculate the "sumSqYi" value
sumSqYi = sumSqYi + SqY
#calculate the "a" and "b" value
a = ((sumY * sumSqXi) - (sumX * sumXiYi)) / (count * (sumSqXi) - sumX ** 2)
b = ((count * sumXiYi) - (sumX * sumY)) / (count * (sumSqXi) - sumX ** 2)
#return the values
return a, b
#definition of "main" method
def main():
#get the text for the window
allPoints, win = graphWin("Regression Line")
#call the method
a, b = average(allPoints)
#set the values
x1 = -10
x2 = 10
#call the "Line" method
regressLine = Line(Point(x1, (a + b * x1)), Point(x2, (a + b * x2)))
#call the "draw" method
regressLine.draw(win)
#get the mouse action
win.getMouse()
#call the "main" method
main()
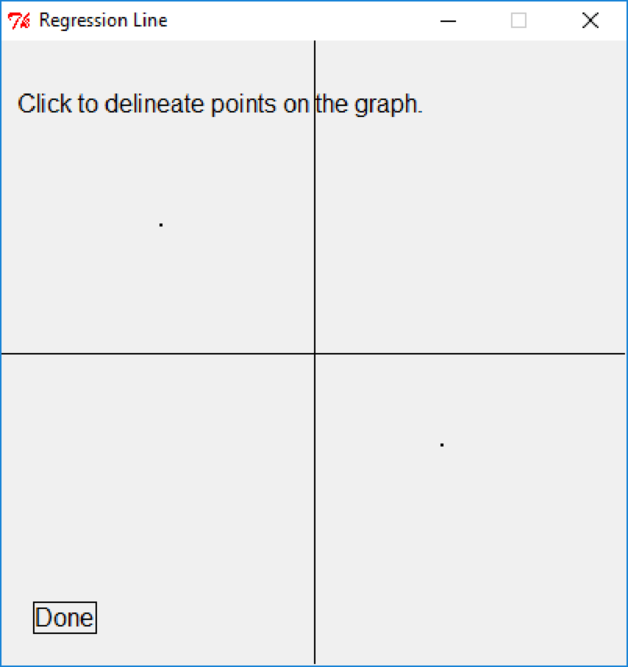
Output:
Screenshot of “Regression Line” window
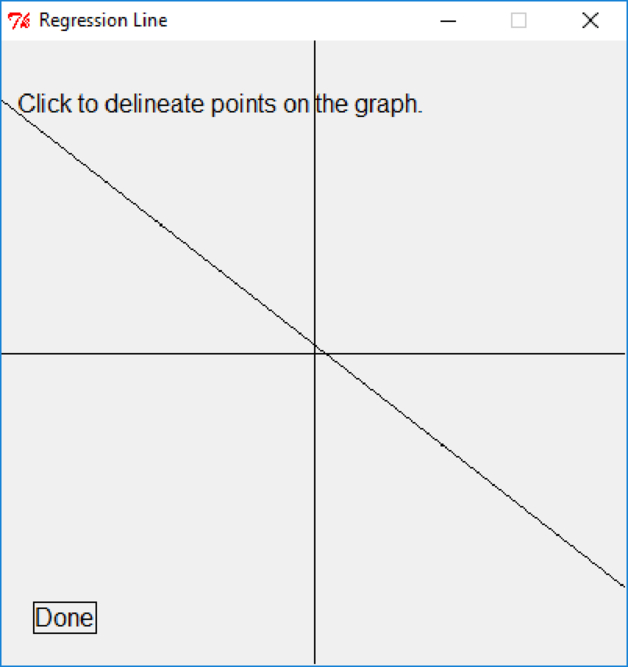
After clicking “Done” button, the below window will appear
Screenshot of “Regression Line” window
Want to see more full solutions like this?
Chapter 8 Solutions
Python Programming: An Introduction to Computer Science, 3rd Ed.


- Write a program that displays the classic BINGO game, displays a BINGO card (5x5 square), and tests the bingo card for a winner via 2 usersarrow_forwardWrite a program to allow the user to calculate the distance between cities on a map. Sounds pretty complicated, eh? Don't worry, we'll make a few simplifications here: The distances are calculated in map units on the 2D map. Each city is given a set of coordinates relative to some point on the map. We'll call this origin (0,0). There can only be a finite number of cities in the system at a given time (you decide this maximum). But in order to make the system useful, we'll have to add a few other features: Each city has a name in addition to its coordinates (you can assume a maximum length for these names; but they must be able to hold spaces: Los Angeles, New York, etc.). The user selects what action to take from a menu: 1) Enter city Information 2) calculate Distance between two cities 3) Print All cities 4) Quit Make sure you allow them to choose their options by both the number and the capitalized letter(s) of the choice. They cannot calculate a distance until at least…arrow_forwardWrite a program in Java to make such a pattern like right angle triangle with number increased by 1. The size of the triangle is measured by the number of rows that will be decided by the user. For example, if the user decides to print out a 3-row right triangle, your program should print out 1 2 3 4 5 6 If the user decides to print out a 4-row right triangle, your program should print out 1 2 3 4 5 6 7 8 9 10arrow_forward
- can you solve this please? Adopt appropriate Java animation code to implement the video in the file “test4.wmv” and given that the parametric equation for a circle. x=r*cos(t) y=r*sin(t) with t in range [0, 2p] and r is the radius of the circle. (the circle goes in a loop like in the images, i did my best to try to explain it , please try to do it ) and here is a sample of what they want me to use : package javaapplication1;import java.awt.*;import java.awt.event.*;import javax.swing.*;import java.awt.geom.*;import java.util.Random;import javax.imageio.*;import java.io.File;import java.io.IOException;import java.awt.image.BufferedImage;import java.awt.event.*;import java.util.Calendar; public class JavaApplication1 extends JApplet { public static void main(String[] args) { JFrame frame=new JFrame(); frame.setTitle("hello"); frame.setDefaultCloseOperation(JFrame.EXIT_ON_CLOSE); JApplet applete =new JavaApplication1(); applete.init();…arrow_forwardIn programming, we use the mask concept to indicate information that can be shown to the user and information that must be “masked”, that is, hidden. In an implementation of a hangman game, we use a mask to indicate which secret word positions the player has already guessed right (whose the contents must therefore be shown to the player), and which positions must remain hidden. Each time that the player hits a letter of the hidden word, the mask is updated so that it has little dashes in the places of letters that the player has not hit yet and show it, in their proper place, the letters that he already hit it. For example, if the word is "cards", the current mask is: - a - - s and the player guesses the letter "d", the mask should be updated to: - a - ds.Write a function called update_mask that takes as input a string containing the word secret (in the example above, this word would be “cards”), a list whose elements are the characters of the current mask (in the example above…arrow_forwardWrite a program that prompts the user to enter thecenter x-, y-coordinates, width, and height of two rectangles and determineswhether the second rectangle is inside the first or overlaps with the first, as shownin Figure . Test your program to cover all cases.arrow_forward
- write a program that read two colored image then converts it to a greyscale image and a monochrome then resize and ?Subtract one image from anotherarrow_forwardWrite a program that reads a mile in a double valuefrom the console, converts it to kilometers, and displays the result. The formulafor the conversion is as follows:1 mile = 1.6 kilometersHere is a sample run:learn from examplesEnter miles: 96 [ENTER]96 miles is 153.6 kilometersarrow_forwardPlease read the thickened sentences below In this game, one flyand three frogs are placed randomly on a board with the size 7x7.In each iteration, they move randomlywithin the board, and the simulation stops when one of the frogs eats the fly.Fly and frogs are essentially creatures that can move, make noise, and eat. Frogs can move up to 2squares in any direction, and flies can move up to 1. Frogs make the "Croak! Croak!" sound, and fliesmake "ZzzZZz!". Since frogs should not eat their kind, a function of "isEatable" should also beimplemented in decision making. A variable or function to check if the fly is alive is also required as aterminate condition for simulation.In each iteration, an 'f' character represents frogs' position on board, and an '*' character is used torepresent the position of fly. Java language please I dont want the survival game starting with the code below I want in Java language and like in photos please #functions def GenerateRandomScene(): scenes =…arrow_forward
- A very known application in natural language processing is to extract information from a given text. In this lab, you will be able to extract some emotions (Sad and Happy) from a given string and calculate the score of each emotion. You will be given below the words that express sadness, anger, and happiness. For each word, you will be given weight as well, so that when you are calculating for example the score for sadness in the text (string), you can use this formula:arrow_forwardWrite a program that displays a checkerboardin which each white and black cell is a Rectangle with a fill color black orwhite, as shown in Figure .arrow_forwardWrite a c++ program to assign passengers seats in an airplane. Assume a small airplane with seat numbering as follows: 1 A B C D 2 A B C D 3 A B C D 4 A B C D 5 A B C D 6 A B C D 7 A B C D The program should display the seat pattern, with an 'X' marking the seats already assigned. For example, after seats 1A, 2B, and 4C are taken, the display should look like this: 1 X B C D 2 A X C D 3 A B C D 4 A B X D 5 A B C D 6 A B C D 7 A B C D After displaying the seats available, the program prompts for the seat desired, the user types in a seat, and then the display of available seats is updated. This continues until all seats are filled or until the user signals that the program should end. If the user types in a seat that is already assigned, the program should say that that seat is occupied and ask…arrow_forward
 Database System ConceptsComputer ScienceISBN:9780078022159Author:Abraham Silberschatz Professor, Henry F. Korth, S. SudarshanPublisher:McGraw-Hill Education
 Starting Out with Python (4th Edition)Computer ScienceISBN:9780134444321Author:Tony GaddisPublisher:PEARSON
 Digital Fundamentals (11th Edition)Computer ScienceISBN:9780132737968Author:Thomas L. FloydPublisher:PEARSON
 C How to Program (8th Edition)Computer ScienceISBN:9780133976892Author:Paul J. Deitel, Harvey DeitelPublisher:PEARSON
 Database Systems: Design, Implementation, & Manag...Computer ScienceISBN:9781337627900Author:Carlos Coronel, Steven MorrisPublisher:Cengage Learning
 Programmable Logic ControllersComputer ScienceISBN:9780073373843Author:Frank D. PetruzellaPublisher:McGraw-Hill Education