Concept explainers
Videos
Cobweb plots (ExH). Here we visualize the simplified version of the Verhuist equation as we’ve seen in Mindscapes 24 and 25. That is, we consider the equation y=cx(1−x), in which c is a given constant value. The graph of this equation is a “sad-face” parabola that crosses the x-axis at x=0 and x=1. The peak of the parabola always occurs at x=0.5. For example, let’s consider the equation y=4x(1−x) (so here, the constant c is equal to 4). If we start with x=0.2, then we can use a calculator to find that y=0.64. If we now repeat, then we plug in 0.64 for x and find that now y=0.9216. If we repeat yet again, we plug 0.9216 in for x in the formula and find that the new y=0.2890....
We can visualize this repeated process on the graph of our sad parabola by first drawing in the diagonal line, y=x, that goes right between the axes at an angle of 45∘. We now start at x=0.2 on the horizontal axis and trace a path by going straight up until we reach the graph (this height yields our first y value, y=0.64). From there we trace a path horizontally (left or right, in this case right) until we hit the diagonal line. Now we repeat the process again: We go up or down (in this case up) until we hit the parabola and that gives us the next y value, y=0.9216. We then repeat again and again. We will generate a path with right-angle turns that go from the parabola to the diagonal line again and again. The first few steps are illustrated and we also include the process with two different starting values (x=0.3 and also x=0.4).
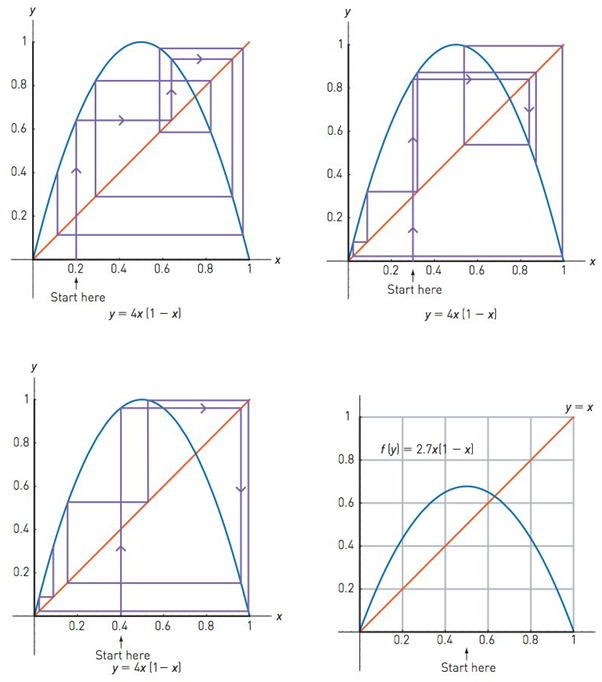
Notice how different the paths look! The Heart of Mathematics Web site contains a program that allows you to see this repeated process for any starting value of x.
These paths are called cobweb plots. The cobweb plot records the results of a repeatedly applied transformation-namely, taking a value for x, applying the formula to find y, then taking that result as the next x and again applying the formula to find the next y, and so on.
Now consider the graph of y=2.7x(1−x) given here. Start on the horizontal axis at 0.5 and carefully draw five iterations of the cobweb plot using a straightedge. Does the cobweb plot form a spiral? You can check your graph using the program on the Heart of Mathematics Web site. (Hint: To help make the drawing accurate, you should compute the y value when x equals 0.5 and then take that value and plug it back into the formula for x, repeat, etc.).
Want to see the full answer?
Check out a sample textbook solution
Chapter 7 Solutions
The Heart of Mathematics: An Invitation to Effective Thinking
Additional Math Textbook Solutions
Basic Business Statistics, Student Value Edition
Thinking Mathematically (6th Edition)
Probability And Statistical Inference (10th Edition)
University Calculus: Early Transcendentals (4th Edition)
Introductory Statistics
Elementary Statistics (13th Edition)


- Diagonalize the following matrix, if possible. 8 0 6 - 8 Select the correct choice below and, if necessary, fill in the answer box to complete your choice. 8 0 OA. For P= D= 0 3 6 0 B. For P = D= 0 -6 8 0 C. For P = D= 0 - 8 D. The matrix cannot be diagonalized.arrow_forwardCalculus lll May I please have the solutions for the following exercises? Thank youarrow_forwardCalculus lll May I please have the solution for the following question? Thank youarrow_forward
- No chatgpt pls will upvotearrow_forwardnot use ai pleasearrow_forward4 In the integral dxf1dy (7)², make the change of variables x = ½(r− s), y = ½(r + s), and evaluate the integral. Hint: Find the limits on r and s by sketching the area of integration in the (x, y) plane along with the r and s axes, and then show that the same area can be covered by s from 0 to r and r from 0 to 1.arrow_forward
- 7. What are all values of 0, for 0≤0<2л, where 2 sin² 0=-sin? - 5π 6 π (A) 0, л, and 6 7π (B) 0,л, 11π , and 6 6 π 3π π (C) 5π 2 2 3 , and π 3π 2π (D) 2' 2'3 , and 3 4元 3 1 די } I -2m 3 1 -3 บ 1 # 1 I 3# 3m 8. The graph of g is shown above. Which of the following is an expression for g(x)? (A) 1+ tan(x) (B) 1-tan (x) (C) 1-tan (2x) (D) 1-tan + X - 9. The function j is given by j(x)=2(sin x)(cos x)-cos x. Solve j(x) = 0 for values of x in the interval Quiz A: Topic 3.10 Trigonometric Equations and Inequalities Created by Bryan Passwaterarrow_forwardnot use ai pleasearrow_forward-xx0. B2 If Xfx(x) find the MGF in the case that fx(x) = - 1 28 exp{-|x − a\/ẞ}, Use the MGF to compute E(X) and Var(X).arrow_forward
 Algebra & Trigonometry with Analytic GeometryAlgebraISBN:9781133382119Author:SwokowskiPublisher:Cengage
 Elementary Geometry For College Students, 7eGeometryISBN:9781337614085Author:Alexander, Daniel C.; Koeberlein, Geralyn M.Publisher:Cengage,
 Holt Mcdougal Larson Pre-algebra: Student Edition...AlgebraISBN:9780547587776Author:HOLT MCDOUGALPublisher:HOLT MCDOUGAL
 Algebra: Structure And Method, Book 1AlgebraISBN:9780395977224Author:Richard G. Brown, Mary P. Dolciani, Robert H. Sorgenfrey, William L. ColePublisher:McDougal Littell
 Elementary AlgebraAlgebraISBN:9780998625713Author:Lynn Marecek, MaryAnne Anthony-SmithPublisher:OpenStax - Rice University
 College Algebra (MindTap Course List)AlgebraISBN:9781305652231Author:R. David Gustafson, Jeff HughesPublisher:Cengage Learning