
Concept explainers
Videos
To Graph: the supply and demand equations and find the market equilibrium.
Answer to Problem 56E
The graph formed is

The equilibrium point is
Explanation of Solution
Given information:
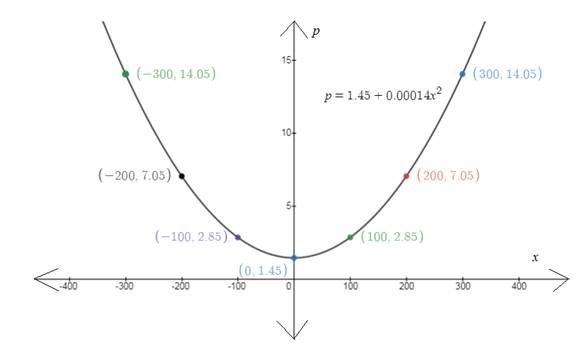
The supply and demand curves for a business dealing with wheat are
Supply equation:
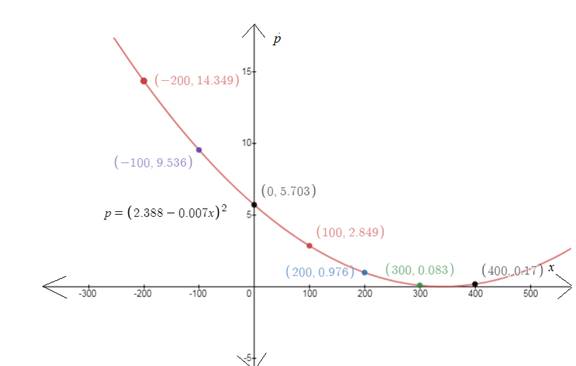
Demand equation is
Where p is the price (in dollars) per bushel and x is the quantity in bushels per day.
Calculation:
For
Plot the points and join them
For
Plot the points and join them
Since these equations are already solved for one particular variable, we can go ahead and put them into our graphing utility.
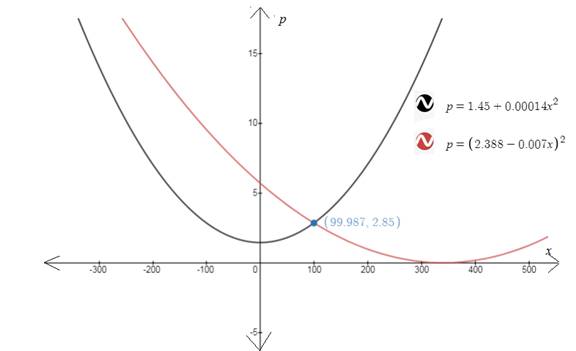
From the graph Equilibrium point is
Chapter 7 Solutions
EBK PRECALCULUS W/LIMITS


 Calculus: Early TranscendentalsCalculusISBN:9781285741550Author:James StewartPublisher:Cengage Learning
 Thomas' Calculus (14th Edition)CalculusISBN:9780134438986Author:Joel R. Hass, Christopher E. Heil, Maurice D. WeirPublisher:PEARSON
 Calculus: Early Transcendentals (3rd Edition)CalculusISBN:9780134763644Author:William L. Briggs, Lyle Cochran, Bernard Gillett, Eric SchulzPublisher:PEARSON
 Calculus: Early TranscendentalsCalculusISBN:9781319050740Author:Jon Rogawski, Colin Adams, Robert FranzosaPublisher:W. H. Freeman
 Calculus: Early Transcendental FunctionsCalculusISBN:9781337552516Author:Ron Larson, Bruce H. EdwardsPublisher:Cengage Learning