
Videos
Standard deviation of returns The following table shows the nominal returns on the U.S. stocks and the rate of inflation.
- a. What was the standard deviation of the nominal market returns?
- b. Calculate the arithmatic average real return.
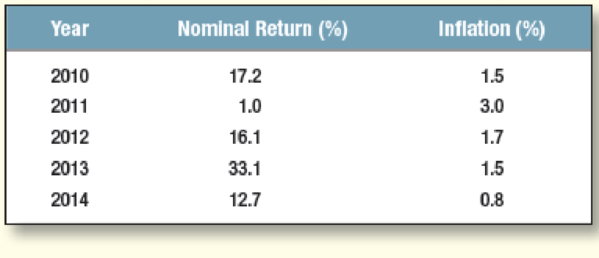
a.
To compute: The standard deviation of nominal market return.
Explanation of Solution
The formula to calculate average nominal return is as follows:
The computation of average nominal return is as follows:
Hence, the average nominal return is 16.02%.
The formula to calculate variance is as follows:
The calculation of variance is as follows:
Hence, the variance is .010595
The formula to calculate standard deviation is as follows:
The Computation of standard deviation is as follows:
Hence, the standard deviation of nominal market return is 10.29%%.
b.
To compute: The arithmetic average real return.
Explanation of Solution
The formula to calculate average real return is as follows:
The computation of average real return is as follows:
Hence, the average real return is .1412, or 14.12%.
Want to see more full solutions like this?
Chapter 7 Solutions
Principles of Corporate Finance (Mcgraw-hill/Irwin Series in Finance, Insurance, and Real Estate)


- Year U.S. Gov’t T-Bills U.K. Common Stocks 2015 0.063 0.150 2016 0.081 0.043 2017 0.076 0.374 2018 0.090 0.192 2019 0.085 0.106 a. Compute the geometric mean rate of return for each of these investments and compare the arithmetic mean return and geometric mean return for each investment and discuss the difference between mean returns as related to the standard deviation of each series.arrow_forwardUse the following information on states of the economy and stock returns to calculate the standard deviation of returns. (Do not round intermediate calculations. Enter your answer as a percent rounded to 2 decimal places.) Probability of State of Security Return if State Occurs State of Economy Economy 0.40 Recession Normal -5.50% 11.00 0.40 0.20 Вoom 17.00arrow_forwardDuring the 1927-2018 period the Sharpe ratio was greatest for which of the following asset classes? Multiple Choice Long-term U.S. Treasury bonds Small/growth U.S. stocks Bond world portfolio return in U.S. dollars Big/value U.S. stocksarrow_forward
- The metric that is used to show the extent to which a given stock’s return move up and down with the stock market? a. Correlation b. Beta c. Standard deviation d. Expected returnarrow_forwardThe following table shows the nominal returns on Brazilian stocks and the rate of inflation. Year Nominal Return (%) 2015 0.3 2016 -16.0 2017 -14.0 2018 -41.9 2019 66.7 27.4 2020 Inflation (%) 6.3 6.4 6.9 11.2 6.8 3.4 a. What was the standard deviation of the market returns? Note: Use decimals, not percents, in your calculations. Do not round intermediate calculations. Enter your answer as a percent rounded to 2 decimal places. b. Calculate the average real return. Note: A negative answer should be indicated by a minus sign. Do not round intermediate calculations. Enter your answer as a percent rounded to 2 decimal places. a. Standard deviation b. Average real return % %arrow_forwardWhat is the average annual return? b. What is the variance of the stock's returns? c. What is the standard deviation of the stock's returns? Note: Notice that the average return and standard deviation must be entered in percentage format. The variance must be entered in decimal format. Year 1 2 3 4 Return (%) Year1: -4.1% Year2: 27.6% Year 3: 12.3% Year 4: 3.6%arrow_forward
- Use the following information on states of the economy and stock returns to calculate the standard deviation of returns. (Do not round intermediate calculations. Enter your answer as a percent rounded to 2 decimal places.) State of Economy Probability ofState of Economy Security Returnif State Occurs Recession 0.40 −4.50 % Normal 0.50 13.00 Boom 0.10 25.00arrow_forwardUse the following information on states of the economy and stock returns to calculate the standard deviation of returns. Note: Do not round intermediate calculations. Enter your answer as a percent rounded to 2 decimal places. State of Economy Recession Normal Boom Standard deviation Probability of State of Economy 0.60 0.25 0.15 4.42% Security Return if State Occurs -5.00% 13.00 17.00arrow_forwardAssume these are the stock market and Treasury bill returns for a 5-year period: Required: a. What was the risk premium on common stock in each year? b. What was the average risk premium? c. What was the standard deviation of the risk premium? (Ignore that the estimation is from a sample of data.)arrow_forward
- Refer the table below on the average excess return of the U.S. equity market and the standard deviation of that excess return. Suppose that the U.S. market is your risky portfolio. Period 1927-2021 1927-1950 1951-1974 1975-1998 1999-2021 Average Annual Returns U.S. equity 12.17 10.26 10.21 17.97 10.16 1-Month T-Bills 3.30 0.93 3.59 6.98 1.66 U.S. Excess return 8.87 9.33 6.62 10.99 8.50 Equity Market Standard Deviation 20.25 26.57 20.32 14.40 18.85 Sharpe Ratio 0.44 0.35 0.33 0.76 0.45 Required: a. If your risk-aversion coefficient is A = 4.9 and you believe that the entire 1927-2021 period is representative of future expected performance, what fraction of your portfolio should be allocated to T-bills and what fraction to equity? Assume your utility function is u = E(r) 0.5 × Ao². b. What if you believe that the 1975-1998 period is representative?arrow_forwardWe know the following expected returns for stocks A and B, given the different states of the economy: State(s) Probability E(rA,s) E(rB,s) Recession 0.1-0.06 0.04 Normal 0.5 0.09 0.07 Expansion 0.4 0.17 0.11 What is the standard deviation of returns for stock B?arrow_forwardRefer the table below on the average excess return of the U.S. equity market and the standard deviation of that excess return. Suppose that the U.S. market is your risky portfolio. Average Annual Returns U.S. Equity Market U.S. 1-Month Excess Standard Sharpe Period equity T-Bills return Deviation Ratio 1927-2021 12.17 3.30 8.87 20.25 0.44 1927-1950 10.26 0.93 9.33 26.57 0.35 1951-1974 10.21 3.59 6.62 20.32 0.33 1975-1998 1999-2021 17.97 6.98 10.99 14.40 0.76 10.16 1.66 8.50 18.85 0.45 Required: a. If your risk-aversion coefficient is A = 3.7 and you believe that the entire 1927-2021 period is representative of future expected performance, what fraction of your portfolio should be allocated to T-bills and what fraction to equity? Assume your utility function is UB-0.5× Ao 2 b. What if you believe that the 1975-1998 period is representative? Complete this question by entering your answers in the tabs below. Required A Required B If your risk-aversion coefficient is A = 3.7 and you…arrow_forward
 Intermediate Financial Management (MindTap Course...FinanceISBN:9781337395083Author:Eugene F. Brigham, Phillip R. DavesPublisher:Cengage Learning