
The question requires us to draw a graph that represents the equilibrium, and also, show the impact of a decreased
Explanation of Solution
When the price of coffee beans falls, the input costs will fall for the suppliers of cups of coffee and thus supply will increase in the market.
The following graph represents the equilibrium in the market for cups of coffee:
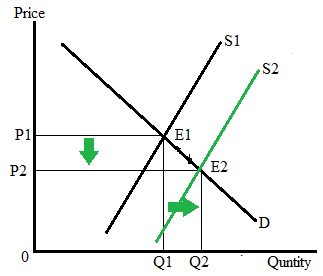
Here, E1 represents the equilibrium point where P1 is the equilibrium price, and Q1 represents the equilibrium quantity in the market for a cup of coffee.
An increase in supply due to the lower costs of production shifts the supply curve to the right from S1 to S2 and causes the equilibrium price to fall from P1 to P2, and the equilibrium quantity to rise from Q1 to Q2.
Answer:
- Point E represents the initial equilibrium in the market.
- Equilibrium price will fall.<
- Equilibrium quantity will increase.
Chapter 7 Solutions
Krugman's Economics For The Ap® Course


 Principles of Economics (12th Edition)EconomicsISBN:9780134078779Author:Karl E. Case, Ray C. Fair, Sharon E. OsterPublisher:PEARSON
 Engineering Economy (17th Edition)EconomicsISBN:9780134870069Author:William G. Sullivan, Elin M. Wicks, C. Patrick KoellingPublisher:PEARSON
 Principles of Economics (MindTap Course List)EconomicsISBN:9781305585126Author:N. Gregory MankiwPublisher:Cengage Learning
 Managerial Economics: A Problem Solving ApproachEconomicsISBN:9781337106665Author:Luke M. Froeb, Brian T. McCann, Michael R. Ward, Mike ShorPublisher:Cengage Learning
 Managerial Economics & Business Strategy (Mcgraw-...EconomicsISBN:9781259290619Author:Michael Baye, Jeff PrincePublisher:McGraw-Hill Education