
Krugman's Economics For The Ap® Course
3rd Edition
ISBN: 9781319113278
Author: David Anderson, Margaret Ray
Publisher: Worth Publishers
expand_more
expand_more
format_list_bulleted
Question
Chapter 7, Problem 1FRQ
To determine
The question requires us to draw a correctly labeled graph representing the equilibrium in the market for tomatoes, and label a
Expert Solution & Answer
Explanation of Solution
The following graph represents the shortage of tomatoes in the market:
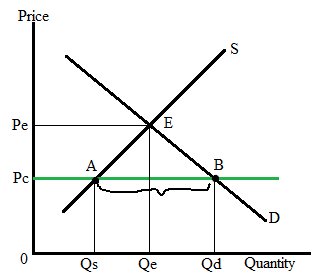
Here, point E represents the equilibrium point in the market where Pe is the
The line PcB represents the price at which the market is facing a shortage of tomatoes because at this price the quantity demanded (Qd) is more than the quantity supplied (Qs).
The quantity difference between points A and B represents the size of the shortage of tomatoes in the market.
Chapter 7 Solutions
Krugman's Economics For The Ap® Course
Knowledge Booster

Recommended textbooks for you

 Principles of Economics (12th Edition)EconomicsISBN:9780134078779Author:Karl E. Case, Ray C. Fair, Sharon E. OsterPublisher:PEARSON
 Engineering Economy (17th Edition)EconomicsISBN:9780134870069Author:William G. Sullivan, Elin M. Wicks, C. Patrick KoellingPublisher:PEARSON
 Principles of Economics (MindTap Course List)EconomicsISBN:9781305585126Author:N. Gregory MankiwPublisher:Cengage Learning
 Managerial Economics: A Problem Solving ApproachEconomicsISBN:9781337106665Author:Luke M. Froeb, Brian T. McCann, Michael R. Ward, Mike ShorPublisher:Cengage Learning
 Managerial Economics & Business Strategy (Mcgraw-...EconomicsISBN:9781259290619Author:Michael Baye, Jeff PrincePublisher:McGraw-Hill Education
Principles of Economics (12th Edition)
Economics
ISBN:9780134078779
Author:Karl E. Case, Ray C. Fair, Sharon E. Oster
Publisher:PEARSON
Engineering Economy (17th Edition)
Economics
ISBN:9780134870069
Author:William G. Sullivan, Elin M. Wicks, C. Patrick Koelling
Publisher:PEARSON
Principles of Economics (MindTap Course List)
Economics
ISBN:9781305585126
Author:N. Gregory Mankiw
Publisher:Cengage Learning
Managerial Economics: A Problem Solving Approach
Economics
ISBN:9781337106665
Author:Luke M. Froeb, Brian T. McCann, Michael R. Ward, Mike Shor
Publisher:Cengage Learning
Managerial Economics & Business Strategy (Mcgraw-...
Economics
ISBN:9781259290619
Author:Michael Baye, Jeff Prince
Publisher:McGraw-Hill Education