
Concept explainers
a)
To determine: The value of control limits.
Introduction: Control charts used to determine whether the process is under control or not. Attributes and variables are the factors under the control charts.
a)
Answer to Problem 8P
The value of control limits is 16.08 and 15.92.
Explanation of Solution
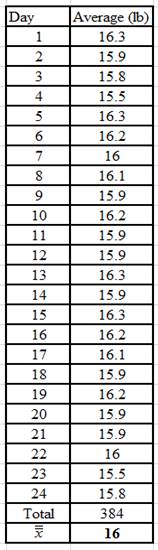
Given information:
The following information is given:

The mean of the sample means
Calculate
It is given that the population mean
Here, the sample size
Substitute the values of
Hence, the standard deviation of the means
Derive the values of upper control limits (UCL) and lower control limits (LCL):
Calculate UCL and LCL using the below formulae:
Here,
The value of
Compute the value of UCL by substituting in UCL formula, the values of
Hence, the upper control limit is
Compute the value of LCL by substituting in LCL formula, the values of
Hence, the lower control limit is
b)
To determine: The value of control limits.
Introduction: Control charts used to determine whether the process is under control or not. Attributes and variables are the factors under the control charts.
b)
Answer to Problem 8P
The value of control limits is 16.12 and 15.88.
Explanation of Solution
Given information:
The following information is given:
The mean of the sample means
Calculate
It is given that the population mean
Here, the sample size
Substitute the values of
Hence, the standard deviation of the means
Derive the values of upper control limits (UCL) and lower control limits (LCL):
Calculate UCL and LCL using the below formulae:
Here,
The value of
Compute the value of UCL by substituting in UCL formula, the values of
Hence, the upper control limit is
Compute the value of LCL by substituting in LCL formula, the values of
Hence, the lower control limit is
The control limits become wider when three standard deviations are used instead of two standard deviations. The process is now allowed wider latitude in terms of natural variations.
Want to see more full solutions like this?
Chapter 6 Solutions
EBK PRINCIPLES OF OPERATIONS MANAGEMENT


- Describe how to construct process control charts and use them to determine whether a process is out of statistical control.arrow_forwardDesigning an x -Chart Using the Process Standard DeviationThe Sunny Dale Bank monitors the time required to serve customers at the drive-through window because it is an important quality factor in competing with other banks in the city. After analyzing the data gathered in an extensive study of the window operation, bank management determined that the mean time to process a customer at the peak demand period is 5 minutes, with a standard deviation of 1.5 minutes. Management wants to monitor the mean time to process a customer by periodically using a sample size of six customers. Assume that the process variability is in statistical control. Design an x-chart that has a type I error of 5 percent. That is, set the control limits so that there is a 2.5 percent chance a sample result will fall below the LCL and a 2.5 percent chance that a sample result will fall above the UCL. After several weeks of sampling, two successive samples came in at 3.70 and 3.68 minutes, respectively. Is the…arrow_forwardA Quality Analyst wants to construct a control chart for determining whether three machines, all producing the same product, are under control with regard to a particular quality variable. Accordingly, he sampled four units of output from each machine, with the following results: Machine Measurements #1 17 15 15 17 #2 16 25 18 25 # 3 23 24 23 22 What is the estimate of the process mean for whenever it is under control? What is the sample average range based upon this limited sample? What are the x-bar chart upper and lower control limits?arrow_forward
- At Gleditsia Triacanthos Company, a certain manufactured part is deemed acceptable if its length is between 12.45 to 12.55 inches. The process is normally distributed with an average of 12.49 inches and a standard deviation of 0.014 inches. a) is the process capable of meeting specifications? b) Does the process meet specifications?arrow_forward6 of 11 5 3. The manager of a building-supplies company randomly samples incoming lumber to see whether it meets quality specifications. From each shipment, 100 pieces of 2 x 4 lumber are inspected and judged according to whether they are first (acceptable) or second (defective) grade. The proportions of second-grade 2 x 4s recorded for 30 shipments were as follows: a. Construct a control chart for the proportion of second-grade 2 x 4s in samples of 100 pieces of lumber. b. Explain how the control chart can be of use to the manager of the building supplies company. Shipment No. Proportion of second grade 1 0.14 2 0.22 3 0.21 4 0.15 0.19 0.26 7 0.18 8 0.22 9 0.23 10 0.21 11 0.2 12 0.14 13 0.25 14 0.2 15 0.19 16 0.18 17 0.22 18 0.22 19 0.17 20 0.21 21 0.21 22 0.13 23 0.15 24 0.2 25 0.23 26 0.23 27 0.12 28 0.19 29 0.19 30 0.26arrow_forwardHow is a process operating in statistical control distinguished from one that is notarrow_forward
- discuss how to construct process control chart and use them to determine whether a process is out of statistical control?arrow_forwardManagement at Webster Chemical Company is concerned as to whether caulking tubes are being properly capped. If a significant proportion of the tubes are not being sealed, Webster is placing its customers in a messy situation. Tubes are packaged in large boxes of 135. Several boxes are inspected, and the following numbers of leaking tubes are found: View an example Sample 1 2 3 Get more help. 4 Tubes 7 7 8 5 1 5 6 7 Calculate p-chart three-sigma control limits to assess whether the capping process is in statistical control. The UCL, equals 1 Sample 8 8 9 10 11 12 13 14 Tubes 7 2 4 8 6 9 MacBook Pro 3 Sample 15 16 17 18 19 20 Total Tubes 8 3 3 5 and the LCL equals (Enter your responses rounded to three decimal places. If your answer for LCL, is negative, enter this value as 0.) 3 6 104 Clear all Check answer Oarrow_forwardThe temperature of a burrito served to a customer in a local Mexican restaurant A: Discrete B; Continousarrow_forward
- Refer to Table S6.1 - Factors for Computing Control Chart Limits (3 sigma) for this problem. Twelve samples, each containing five parts, were taken from a process that produces steel rods at Emmanual Kodzi's factory. The length of each rod in the samples was determined. The results were tabulated and sample means and ranges were computed. The results were: Sample Mean (in.) Range (in.) Sample Sample Sample Mean (in.) Range (in.) 1 9.404 0.044 7 9.403 0.021 2 9.402 0.051 8 9.405 0.058 3 9.393 0.042 9.395 0.039 4 9.404 0.037 10 9.401 0.038 9.399 0.048 11 9.401 0.054 9.397 0.053 12 9.404 0.061 For the given data, the x = inches (round your response to four decimal places). Based on the sampling done, the control limits for 3-sigma x chart are: Upper Control Limit (UCL;) = inches (round your response to four decimal places). Lower Control Limit (LCL;) = inches (round your response to four decimal places).arrow_forwardExplain how to construct process control chart and use them to determine whether a process is out of statistical control?arrow_forwardAn e-commerce website has received some complaints on Billing errors. Managers ask the accounting department to monitor the shipping process and make sure of the quality in their process. To monitor the process, for 10 consecutive weeks, they look into the first 100 shipments and count the number of Billing errors as shown in table below: 45 52 6 3 63 7 8 9 10 1 6 1 2 Construct a two-sigma limit control chart to show whether the shipping process in this e-commerce firm needs any improvement or performs at an acceptable level. (Round your answer to three decimal places.) Week 1 2 3 Number of Billing errors. 5 1 3 Upper Control Limit Lower Control Limitarrow_forward
 Practical Management ScienceOperations ManagementISBN:9781337406659Author:WINSTON, Wayne L.Publisher:Cengage,
 Operations ManagementOperations ManagementISBN:9781259667473Author:William J StevensonPublisher:McGraw-Hill Education
 Operations and Supply Chain Management (Mcgraw-hi...Operations ManagementISBN:9781259666100Author:F. Robert Jacobs, Richard B ChasePublisher:McGraw-Hill Education
 Purchasing and Supply Chain ManagementOperations ManagementISBN:9781285869681Author:Robert M. Monczka, Robert B. Handfield, Larry C. Giunipero, James L. PattersonPublisher:Cengage Learning
 Production and Operations Analysis, Seventh Editi...Operations ManagementISBN:9781478623069Author:Steven Nahmias, Tava Lennon OlsenPublisher:Waveland Press, Inc.