
Concept explainers
a)
To establish: Upper and lower control limits for the control chart and graph the data.
Introduction: Control charts used to determine whether the process is under control or not. Attributes and variables are the factors under the control charts.
a)
Answer to Problem 20P
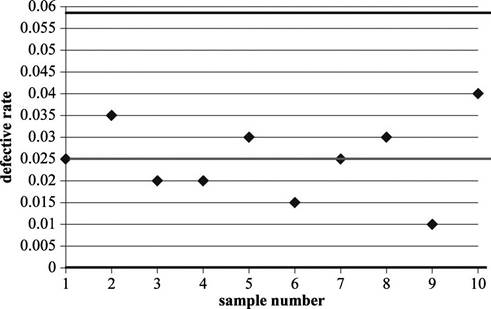
The upper control limit is 0.05812 and lower control limit is 0.
Explanation of Solution
Given information:
The following information is given:
| Sample | 1 | 2 | 3 | 4 | 5 | 6 | 7 | 8 | 9 | 10 |
| Defectives | 5 | 7 | 4 | 4 | 6 | 3 | 5 | 6 | 2 | 8 |
Compute the defective rate
Defective rate is calculated by dividing the sum of defectives and multiple of number of samples and
Determine
Sample size is given as 200 and the defective rate is calculated as 0.025. Substitute the values in above equation. Hence, the standard deviation is 0.01104.
Determine UCL:
It can be calculated by adding the defective rate with the value attained by multiplying the number of standard deviation for setting the limit and standard deviation of the sampling distribution.
Hence, the UCL value is 0.05812.
Determine LCL:
It can be calculated by subtracting the defective rate with the value attained by multiplying the number of standard deviation for setting the limit and standard deviation of the sampling distribution.
Hence, the LCL value is 0.
Draw a p-chart for the attained values:
b)
To determine: Whether the process been in control.
Introduction: Control charts used to determine whether the process is under control or not. Attributes and variables are the factors under the control charts.
b)
Answer to Problem 20P
The process been in control.
Explanation of Solution
Given information:
The following information is given:
| Sample | 1 | 2 | 3 | 4 | 5 | 6 | 7 | 8 | 9 | 10 |
| Defectives | 5 | 7 | 4 | 4 | 6 | 3 | 5 | 6 | 2 | 8 |
Determine whether the process in control:
Since all the values are within the upper and lower control limits, the process seems to be in control.
The last two samples, sample number #9 and sample number #10 are showing a wider dispersion from the center line. Further samples need to be drawn and verified whether the defective rates increase in dispersion.
c)
To establish: Upper and lower control limits for the control chart and graph the data, if the sample size were 100.
Introduction: Control charts used to determine whether the process is under control or not. Attributes and variables are the factors under the control charts.
c)
Answer to Problem 20P
The upper control limit is 0.11537 and lower control limit is 0.
Explanation of Solution
Given information:
The following information is given:
| Sample | 1 | 2 | 3 | 4 | 5 | 6 | 7 | 8 | 9 | 10 |
| Defectives | 5 | 7 | 4 | 4 | 6 | 3 | 5 | 6 | 2 | 8 |
Compute the defective rate
Defective rate is calculated by dividing the sum of defectives and multiple of number of samples and sample size. Hence, the defective rate is 0.05.
Determine
Sample size is given as 100 and the defective rate is calculated as 0.05. Substitute the values in above equation. Hence, the standard deviation is 0.02179.
Determine UCL:
It can be calculated by adding the defective rate with the value attained by multiplying the number of standard deviation for setting the limit and standard deviation of the sampling distribution.
Hence, the UCL value is 0.11537.
Determine LCL:
It can be calculated by subtracting the defective rate with the value attained by multiplying the number of standard deviation for setting the limit and standard deviation of the sampling distribution.
Hence, the LCL value is 0.
Draw a p-chart for the attained values:
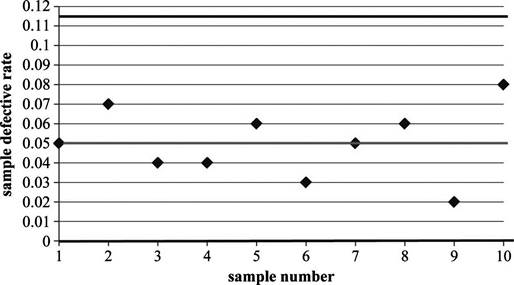
Since all the values are within the upper and lower control limits, the process seems to be in control. This is expected, as the observations were within the limits even when the limits were narrower.
Want to see more full solutions like this?
Chapter 6 Solutions
EBK PRINCIPLES OF OPERATIONS MANAGEMENT


- discuss how to construct process control chart and use them to determine whether a process is out of statistical control?arrow_forwardChocolate, Inc. manufactures 4 ounce chocolate bars. Random samples of size four were taken and weighed. Eight hours of observation provided the following data. Sample Mean Range 1 3.96 0.13 2 4.03 0.16 3 3.97 0.16 4 4.14 0.16 5 3.88 0.11 6 4.03 0.18 7 4.04 0.18 8 4.07 0.14 (a) Determine the upper and lower control limits for the x chart. (Round your answers to four decimal places.) UCL=?? LCL=?? (b) Determine the upper and lower control limits for the R chart. (Round your answers to four decimal places.) UCL=?? LCL=??arrow_forwardDescribe how to construct process control charts and use them to determine whether a process is out of statistical control.arrow_forward
- Administering new bank accounts is intended to average 15 minutes each. Five samples of four observations each have been taken. Use the sample data in concurrence with Table 2.3 to create upper and lower control limits for both a mean chart and a range chart. Do results propose that the procedure is in control? Sample 1 Sample 2 Sample 3 Sample 4 Sample 5 11.2 11.3 10.7 10.9 10.8 10.9 10.8 10.9 11.3 11.2 10.8 10.9 10.9 11.1 11.3 11.1 11.4 11.1 11.5 10.7 Total: 44 44.4 43.6 44.8 44arrow_forwardJamison Kovach Supply Company manufactures paper clips and other office products. Although inexpensive, paper clips have provided the firm with a high margin of profitability. Sample size is 50. Results are given for the last 10 samples. Sample 1 2 3 4 5 6 7 8 9 10 Defectives 5 7 2 5 6 5 5 4 1 11 Part 2 The type of control chart that is best to monitor this process is p minus chartp−chart . Part 3 a) Establish the control limits to include 99.73% of the random variation in defectives. UCLp = enter your response here (enter your response as a number between 0 and 1, rounded to three decimal places).arrow_forwardWhat trade-offs are involved in each of these decisions?b. Choosing between a large sample size and a smaller sample size.arrow_forward
- Select three service companies or organizations you arefamiliar with and indicate how process control charts couldbe used in each.arrow_forwardCan you please explain the steps to create the control chart ?arrow_forwardconcernedas to whether caulking tubes are being properly capped. Ifa significant proportion of the tubes are not being sealed,Webster is placing its customers in a messy situation.Tubes are packaged in large boxes of 144. Several boxes areinspected, and the following numbers of leaking tubes arefound: Calculate p-chart three-sigma control limits to assesswhether the capping process is in statistical control.arrow_forward
- Explain the concept and use of statistical quality control? Name control charts that can be usedarrow_forwardThe results of an inspection of DNA samples takenover the past 10 days are given below. Sample size is 100. a) Construct a 3-sigma p -chart using this information. b) Using the control chart in part (a), and finding that the num-ber of defectives on the next three days are 12, 5, and 13, is the process in control?arrow_forwardInter-State Moving and Storage Company wishes to establish a control chart to monitor the proportion of residential moves that result in written complaints due to late delivery, lost items, or damaged items. A sample of 40 moves is selected for each of the last 12 months. The number of written complaints in each sample is 9, 7, 4, 9, 1, 9, 11, 5, 5, 8, 7, and 15. Number Defective Percent defective 9 18 7 14 4 8 9 18 1 2 9 18 11 22 5 10 5 10 8 16 7 14 15 30 a. Insert the mean proportion defective, UCL, and LCL. (Leave no cells blank - be certain to enter "0" wherever required. Round your intermediate calculations and final answers to 2 decimal places.) Mean proportion defective UCL LCL c. Does it appear that the number of complaints is out of control for any of the months?multiple choice Yes Noarrow_forward
 Practical Management ScienceOperations ManagementISBN:9781337406659Author:WINSTON, Wayne L.Publisher:Cengage,
 Operations ManagementOperations ManagementISBN:9781259667473Author:William J StevensonPublisher:McGraw-Hill Education
 Operations and Supply Chain Management (Mcgraw-hi...Operations ManagementISBN:9781259666100Author:F. Robert Jacobs, Richard B ChasePublisher:McGraw-Hill Education
 Purchasing and Supply Chain ManagementOperations ManagementISBN:9781285869681Author:Robert M. Monczka, Robert B. Handfield, Larry C. Giunipero, James L. PattersonPublisher:Cengage Learning
 Production and Operations Analysis, Seventh Editi...Operations ManagementISBN:9781478623069Author:Steven Nahmias, Tava Lennon OlsenPublisher:Waveland Press, Inc.