
a)
The correctly labeled graph when the
a)
Explanation of Solution
When the price of the product being produced decreases by assuming ceteris paribus Then, the labeled graph will show the curves as follows:
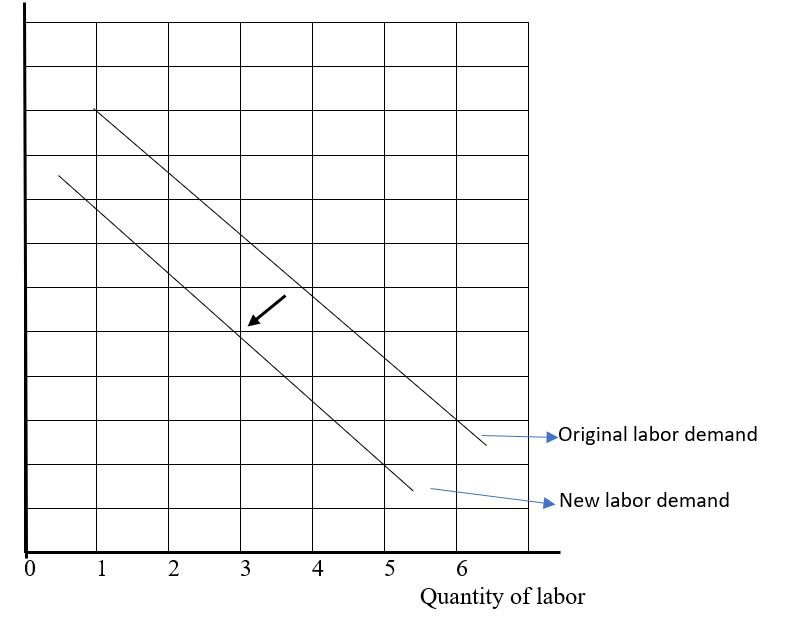
When the price of the product is decreased, then the labor demand curve shifts to the left because the demand for labor would decrease when the demand for goods and services decreases.
Introduction: A demand curve is a graphical representation that shows how sensitive demand is toward the price of a good or service.
Labor is the human capital or human resource that is the factor of production for any firm.
b)
The correctly labeled graph when worker productivity increases by assuming ceteris paribus
b)
Explanation of Solution
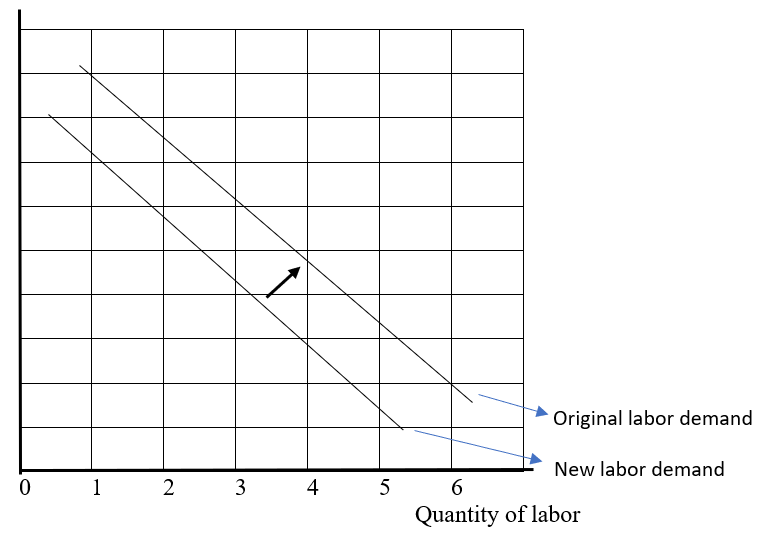
When the worker productivity increases and other things remain unchanged, then the demand for labor will shift to the right because when the workforce is well-trained only then the employers will hire them otherwise, they will not be hired from the large pool of labor.
Therefore, the demand for labor on graphical curves will be shown as follows:
Introduction: A demand curve is a graphical representation that shows how sensitive demand is toward the price of a good or service.
Labor is the human capital or human resource that is the factor of production for any firm.
c)
The correctly labeled graph when firms invest in more capital to be used by workers by assuming ceteris paribus
c)
Explanation of Solution
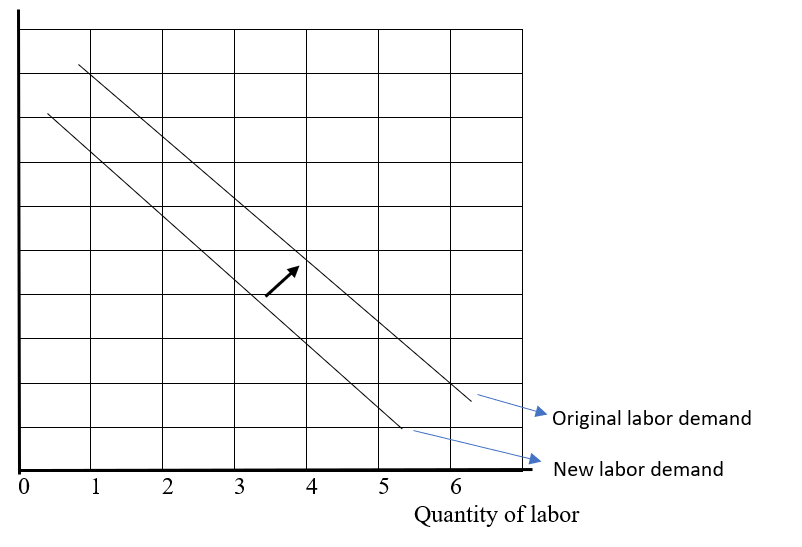
When firms invest in more capital to be used by workers by assuming other things remain the same, the labor for demand shifts to the right because the demand for labor depends on the demand for goods and services in the market. When a firm invests in the capital, it shows there is more demand for goods and services which in turn increase the demand for labor in the market.
Therefore, the demand for labor would be represented on the graph as follows:
Introduction: A demand curve is a graphical representation that shows how sensitive demand is toward the price of a good or service.
Labor is the human capital or human resource that is the factor of production for any firm.
Chapter 69 Solutions
Krugman's Economics For The Ap® Course


 Principles of Economics (12th Edition)EconomicsISBN:9780134078779Author:Karl E. Case, Ray C. Fair, Sharon E. OsterPublisher:PEARSON
 Engineering Economy (17th Edition)EconomicsISBN:9780134870069Author:William G. Sullivan, Elin M. Wicks, C. Patrick KoellingPublisher:PEARSON
 Principles of Economics (MindTap Course List)EconomicsISBN:9781305585126Author:N. Gregory MankiwPublisher:Cengage Learning
 Managerial Economics: A Problem Solving ApproachEconomicsISBN:9781337106665Author:Luke M. Froeb, Brian T. McCann, Michael R. Ward, Mike ShorPublisher:Cengage Learning
 Managerial Economics & Business Strategy (Mcgraw-...EconomicsISBN:9781259290619Author:Michael Baye, Jeff PrincePublisher:McGraw-Hill Education