
a)
The marginal revenue product of labor of the 3rd worker.
a)
Answer to Problem 1FRQ
The marginal revenue product of labor of the 3rd worker is $2,250.
Explanation of Solution
As an umbrella is sold at $15, the table would represent the following data:
| Q (labor) | Q (umbrella) | Marginal product |
| 0 | 0 | 0 |
| 1 | 300 | 300 |
| 2 | 550 | 250 |
| 3 | 700 | 150 |
| 4 | 800 | 100 |
| 5 | 850 | 50 |
| 6 | 890 | 40 |
Therefore, the marginal revenue product of labor of the 3rd worker is $2,250
Introduction: A demand curve is a graphical representation that shows how sensitive demand is toward the
Marginal revenue is the earning or benefit which is obtained by using an additional unit of the product or factor of production.
b)
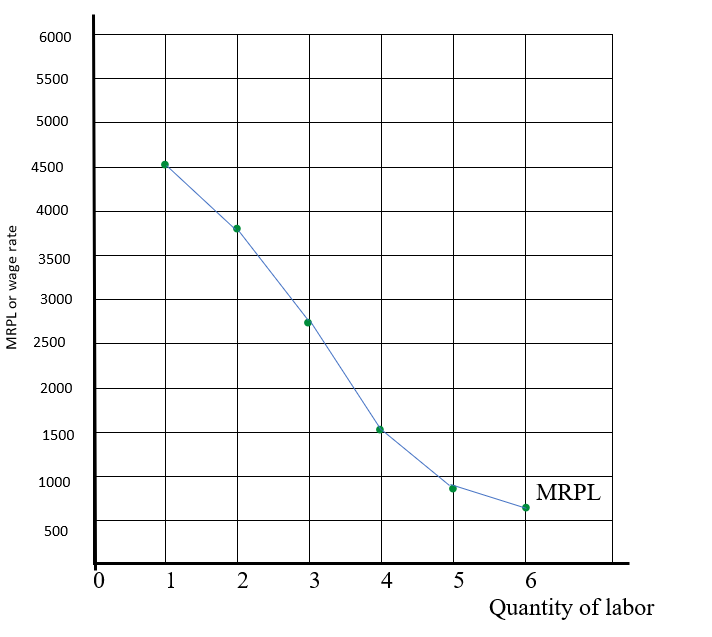
The correctly labeled graph shows the firm’s demand curve for labor.
b)
Explanation of Solution
By using a marginal product and price of $15 the MRPL would be:
| Q (labor) | Q (umbrella) | Marginal product | MRPL at $15 |
| 0 | 0 | 0 | 0 |
| 1 | 300 | 300 | 4500 |
| 2 | 550 | 250 | 3750 |
| 3 | 700 | 150 | 2250 |
| 4 | 800 | 100 | 1500 |
| 5 | 850 | 50 | 750 |
| 6 | 890 | 40 | 600 |
From the data in the table, the graph will show MRPL curve downward because by using extra units of labor, the change in total output started to decline, which makes the slope downward. And, here, the price of output is also constant at $15 by hiring more labor, which causes the demand curve to slope downward.
Therefore, the graphical presentation of data is as follows:
Introduction: A demand curve is a graphical representation that shows how sensitive demand is toward the price of a good or service.
Labor is the human capital or human resource that is the factor of production for any firm.
c)
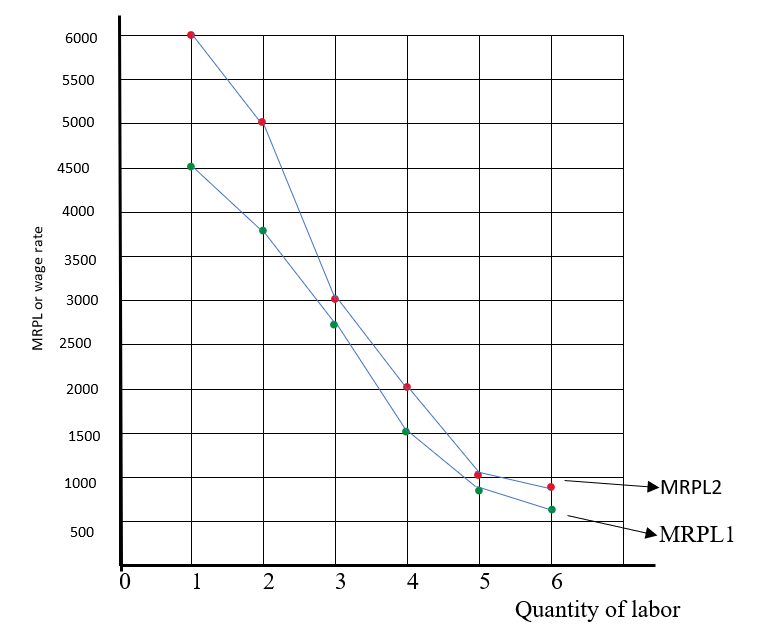
The demand curve for labor if the price of umbrellas increases to $20.
c)
Explanation of Solution
When the price increase to $20 then, the MRPL would be:
| Q (labor) | Q (umbrella) | Marginal product | MRPL at $20 |
| 0 | 0 | 0 | 0 |
| 1 | 300 | 300 | 6000 |
| 2 | 550 | 250 | 5000 |
| 3 | 700 | 150 | 3000 |
| 4 | 800 | 100 | 2000 |
| 5 | 850 | 50 | 1000 |
| 6 | 890 | 40 | 800 |
From the data in the table, the graph will show the new MRPL curve downward and shift to the right because by increasing the price to $20 with the use of extra units of labor, the change in total output started to decline, which makes the curve slope downward. And, here, the price of output is also constant at $20 by hiring more labor, which causes the demand curve to slope downward.
Therefore, the graphical presentation of data is as follows:
Introduction: A demand curve is a graphical representation that shows how sensitive demand is toward the price of a good or service.
Labor is the human capital or human resource that is the factor of production for any firm.
d)
The total quantity that will be produced with each quantity of labor when technological advance doubles the productivity of workers
d)
Answer to Problem 1FRQ
The total quantity that will be produced with each quantity of labor when technological advance doubles the productivity of workers would be 600, 1100, 1400, 1600, 1700, and 1780.
Explanation of Solution
The table would represent the following data when the quantity is doubled:
| Q (labor) | Q (umbrella) | New quantity which doubles the old |
| 0 | 0 | 0 |
| 1 | 300 | 600 (300×2) |
| 2 | 550 | 1,100 (550×2) |
| 3 | 700 | 1400 (700×2) |
| 4 | 800 | 1600 |
| 5 | 850 | 1700 |
| 6 | 890 | 1780 |
Therefore, by doubling the number of umbrellas, at each quantity of labor, the total quantity will be produced as 600, 1100, 1400, 1600, 1700, and 1780.
Introduction: Total quantity is the output that is obtained by using the units of the factor of production.
Chapter 69 Solutions
Krugman's Economics For The Ap® Course


 Principles of Economics (12th Edition)EconomicsISBN:9780134078779Author:Karl E. Case, Ray C. Fair, Sharon E. OsterPublisher:PEARSON
 Engineering Economy (17th Edition)EconomicsISBN:9780134870069Author:William G. Sullivan, Elin M. Wicks, C. Patrick KoellingPublisher:PEARSON
 Principles of Economics (MindTap Course List)EconomicsISBN:9781305585126Author:N. Gregory MankiwPublisher:Cengage Learning
 Managerial Economics: A Problem Solving ApproachEconomicsISBN:9781337106665Author:Luke M. Froeb, Brian T. McCann, Michael R. Ward, Mike ShorPublisher:Cengage Learning
 Managerial Economics & Business Strategy (Mcgraw-...EconomicsISBN:9781259290619Author:Michael Baye, Jeff PrincePublisher:McGraw-Hill Education