
An Introduction to Statistical Methods and Data Analysis
7th Edition
ISBN: 9781305269477
Author: R. Lyman Ott, Micheal T. Longnecker
Publisher: Cengage Learning
expand_more
expand_more
format_list_bulleted
Concept explainers
Videos
Textbook Question
Chapter 6.9, Problem 28E
The paper “Effect of Long-Term Blood Pressure Control on Salt Sensitivity” [Journal of Medicine (1997) 28:147–156] describes a study evaluating salt sensitivity (SENS) after a period of antihypertensive treatment. Ten hypertensive patients (diastolic blood pressure between 90 and 115 mmHg) were studied after at least 18 months on antihypertensive treatment. SENS readings, which were obtained before and after the patients were placed on an antihypertensive treatment, are given here.
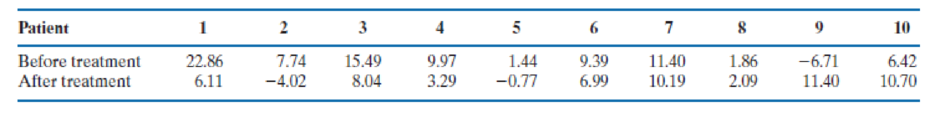
- a. Is there significant evidence that the
mean SENS value decreased after the patient received antihypertensive treatment? - b. Estimate the size of the change in the mean SENS value.
- c. Do the conditions required for using the t procedures appear to be valid for these data? Justify your answer.
Expert Solution & Answer

Trending nowThis is a popular solution!

Students have asked these similar questions
The paper “Effect of Long-Term Blood Pressure Control on Salt Sensitivity” [Journal of Medicine (1997) 28:147–156] describes a study evaluating salt sensitivity (SENS) after a period of antihypertensive treatment. Ten hypertensive patients (diastolic blood pressure between 90 and 115 mmHg)were studied after at least 18 months on antihypertensive treatment. SENS readings, which wereobtained before and after the patients were placed on an antihypertensive treatment, are given here.
Is there significant evidence that the mean SENS value decreased after the patient received antihypertensive treatment?
The paper “Effect of long-term blood pressure control on salt sensitivity” [Journal of Medicine (1997) 28:147–156] describes a study evaluating salt sensitivity (SENS) after a period of antihypertensive treatment. Ten hypertensive patients (diastolic blood pressure between 90 and 115 mmHg) were studied after at least 18 months on antihypertensive treatment. SENS readings, which were obtained before and after the patients were placed on an antihypertensive treatment, are given in data 3. Is there significant evidence that the mean SENS value decreased after the patient received antihypertensive treatment?
data 3
'Before' 'After'22.86 6.117.74 -4.0215.49 8.049.97 3.291.44 -0.779.39 6.9911.4 10.191.86 2.09-6.71 11.46.42 10.7
The paper “Effect of long-term blood pressure control on salt sensitivity” [Journal of Medicine (1997) 28:147–156] describes a study evaluating salt sensitivity (SENS) after a period of antihypertensive treatment. Ten hypertensive patients (diastolic blood pressure between 90 and 115 mmHg) were studied after at least 18 months on antihypertensive treatment. SENS readings, which were obtained before and after the patients were placed on an antihypertensive treatment, are given in the table.
'Before'
'After'
22.86
6.11
7.74
-4.02
15.49
8.04
9.97
3.29
1.44
-0.77
9.39
6.99
11.4
10.19
1.86
2.09
-6.71
11.4
6.42
10.7
a) Write the null and alternate hypotheses
What test will be used to test the hypothesis and what assumptions are required? test them.
Is there significant evidence that the mean SENS value decreased after the patient received antihypertensive treatment?
Chapter 6 Solutions
An Introduction to Statistical Methods and Data Analysis
Ch. 6.9 - Refer to the oil-spill case study.
What are the...Ch. 6.9 - For each of the situations, set up the rejection...Ch. 6.9 - Conduct a test of H0 : μ1 μ2 – 2.3 versus Ha : μ1...Ch. 6.9 - In an effort to link cold environments with...Ch. 6.9 - The Department of Natural Resources (DNR) received...Ch. 6.9 - An industrial engineer conjectures that a major...Ch. 6.9 - The number of households currently receiving a...Ch. 6.9 - Prob. 9ECh. 6.9 - Refer to Exercise 6.11. There appears to be a...Ch. 6.9 - A firm has a generous but rather complicated...
Ch. 6.9 - Prob. 14ECh. 6.9 - Random samples of size n1 = 8 and n2 = 8 were...Ch. 6.9 - Prob. 16ECh. 6.9 - Prob. 17ECh. 6.9 - The paper Serum Beta-2-Microglobulin (SB2M) in...Ch. 6.9 - Prob. 19ECh. 6.9 - Prob. 20ECh. 6.9 - Prob. 21ECh. 6.9 - Prob. 22ECh. 6.9 - A random sample of eight pairs of twins was...Ch. 6.9 - Refer to the data of Exercise 6.11. A potential...Ch. 6.9 - Researchers are studying two existing coatings...Ch. 6.9 - Prob. 27ECh. 6.9 - The paper “Effect of Long-Term Blood Pressure...Ch. 6.9 - A study was designed to measure the effect of home...Ch. 6.9 - Prob. 30ECh. 6.9 - A random sample of eight pairs of twins were...Ch. 6.9 - Refer to Exercise 6.31. a. What is the level of...Ch. 6.9 - Use the level and power values for the paired t...Ch. 6.9 - Use the level and power values for the paired t...Ch. 6.9 - A study was conducted to determine whether...Ch. 6.9 - The effect of Benzedrine on the heart rate of dogs...Ch. 6.9 - Prob. 37E
Knowledge Booster


Learn more about
Need a deep-dive on the concept behind this application? Look no further. Learn more about this topic, statistics and related others by exploring similar questions and additional content below.Similar questions
- A study was made of 413 children who were hospitalized as a result of motor vehicle crashes. Among 290 children who were not using seat belts, 60 were injured severely. Among 123 children using seat belts, 16 were injured severely (based on data from "Morbidity Among Pediatric Motor Vehicle Crash Victims: The Effectiveness of Seat Belts," by Osberg and Di Scala, American Journal of Public Health, Vol. 82, No. 3). For this problem we want to know, is there sufficient sample evidence to conclude, at the 0.05 significance level, that the proportion of severe injuries is higher for children not wearing seat belts? Let pi be the proportion of severe injuries among all children not wearing seatbelts and who were involved in crashes. Let p2 be the proportion of severe injuries among all children wearing seatbelts and who were involved in crashes. Which is the proper expression of Ho? Pi = P2 O Pi P2 Which is the proper expression of H1? O pi P2 Calculate p1 to 4 decimal places: Calculate p,…arrow_forwardA study assessed the lung destructive index among smokers and non- smokers provided the following data Smokers : overline x 1 =14.5 n 1 =12 S P =2.50 Non- Smokers: overline x 2 =9.5 n 2 =10 a = .05 From the available data, can we conclude that smokers have greater lung damage than non-smokers?arrow_forwardA study was made of 425 children who were hospitalized as a result of motor vehicle crashes. Among 300 children who were not using seat belts, 50 were injured severely. Among 125 children using seat belts, 10 were injured severely (based on data from "Morbidity Among Pediatric Motor Vehicle Crash Victims: The Effectiveness of Seat Belts," by Osberg and Di Scala, American Journal of Public Health, Vol. 82, No. 3). For this problem we want to know, is there sufficient sample evidence to conclude, at the 0.05 significance level, that the proportion of severe injuries is higher for children not wearing seat belts? Let pi be the proportion of severe injuries among all children not wearing seatbelts and who were involved in crashes. Let p2 be the proportion of severe injuries among all children wearing seatbelts and who were involved in crashes. Which is the proper expression of Ho? P1 > P2 P1 P2 Calculate p1 to 4 decimal places: Calculate p2 to 4 decimal places: Calculate the pooled sample…arrow_forward
- “Passive and Active Smoke” in Appendix B includes cotinine levels measured in a group of nonsmokers exposed to tobacco smoke (n = 40, Mean = 60.58 ng>mL, s = 138.08 ng>mL) and a group of nonsmokers not exposed to tobacco smoke (n = 40, Mean = 16.35 ng>mL, s = 62.53 ng>mL). Cotinine is a metabolite of nicotine, meaning that when nicotine is absorbed by the body, cotinine is produced. Use a 0.05 significance level to test the claim that nonsmokers exposed to tobacco smoke have a higher mean cotinine level than nonsmokers not exposed to tobacco smoke. Based on your hypothesis tests and confidence intervals, what do you conclude about the effects of second hand smoke? Why?arrow_forwardAre seatbelts effective at saving lives? We wish to examine whether or not the use of seatbelts reduces fatalities at the a = 0.01 level of significance. Let pN represent the proportion of non-seatbelt wearing passengers who were involved in a crash and died and py represent the proportion of seatbelt wearing passengers who were involved in a crash and died. NOTE: The data used in this study were obtained through observational study...no experiment was conducted! Which would be correct hypotheses for this test? O Ho:PN = pY, H1:PN > pY Ho: PN = pY, H,:PN Py In a random sample of 321 non-seatbelt wearing passengers involved in a car crash, 30 were killed. In a random sample of 492 seatbelt wearing passengers involved in a car crash, 13 were killed. Find the test statistic (2 decimal places): Give the P-value (4 decimal places - if less than 0.001 answer 0): Which is the correct result: Reject the Null Hypothesis O Do not Reject the Null Hypothesis Which would be the appropriate…arrow_forward“Passive and Active Smoke” in Appendix B includes cotinine levels measured in a group of nonsmokers exposed to tobacco smoke (n = 40, Mean = 60.58 ng>mL, s = 138.08 ng>mL) and a group of nonsmokers not exposed to tobacco smoke (n = 40, Mean = 16.35 ng>mL, s = 62.53 ng>mL). Cotinine is a metabolite of nicotine, meaning that when nicotine is absorbed by the body, cotinine is produced. Use a 0.05 significance level to test the claim that nonsmokers exposed to tobacco smoke have a higher mean cotinine level than nonsmokers not exposed to tobacco smoke. 1. Construct a confidence interval estimate of the difference betwen the mean continen levels fo the two groups of nonsmokers. What confidence level would be appropriate? 2. Find the margin of error E using the formula. 3. What is the confidence interval? Explain the meaning of the confidence interal and what the limit represents.arrow_forward
- 27. No Variation in a Sample An experiment was conducted to test the effects of alcohol. Re- searchers measured the breath alcohol levels for a treatment group of people who drank ethanol and another group given a placebo. The results are given below (based on data from "Effects of Alcohol Intoxication on Risk Taking, Strategy, and Error Rate in Visuomotor Performance," by Streufert et al., Journal of Applied Psychology, Vol. 77, No. 4). Use a 0.05 significance level to test the claim that the two sample groups come from populations with the same mean. Treatment Group: nj 22, x¡ 0.049, s = 0.015 %3D %3D Placebo Group: n = 22, x, 0.000, s, = 0.000 %3D %3Darrow_forwardThe authors of the paper "Statistical Methods for Assessing Agreement Between Two Methods of Clinical Measurement" compared two different instruments for measuring a subject's ability to breathe out air.+ (This measurement is helpful in diagnosing various lung disorders.) The two instruments considered were a Wright peak flow meter and a mini-Wright peak flow meter. Seventeen subjects participated in the study, and for each subject air flow was measured once using the Wright meter and once using the mini-Wright meter. Mini- Subject Wright Meter 1 2 3 4 5 6 7 8 9 512 430 520 428 500 600 364 380 658 Wright Meter 494 395 516 434 476 557 413 442 650 Subject 10 11 12 13 14 15 16 17 Mini- Wright Meter 445 432 626 260 477 259 350 451 Wright Meter 433 417 656 267 478 178 423 427 (a) Suppose that the Wright meter is considered to provide a better measure of air flow, but the mini-Wright meter is easier to transport and to use. If the two types of meters produce different readings but there is a…arrow_forwardThe authors of the paper "Statistical Methods for Assessing Agreement Between Two Methods of Clinical Measurement"† compared two different instruments for measuring a person's ability to breathe out air. (This measurement is helpful in diagnosing various lung disorders.) The two instruments considered were a Wright peak flow meter and a mini-Wright peak flow meter. Seventeen people participated in the study, and for each person air flow was measured once using the Wright meter and once using the mini-Wright meter. Subject Mini-WrightMeter WrightMeter Subject Mini-WrightMeter WrightMeter 1 512 494 10 445 433 2 430 395 11 432 417 3 520 516 12 626 656 4 428 434 13 260 267 5 500 476 14 477 478 6 600 557 15 259 178 7 364 413 16 350 423 8 380 442 17 451 427 9 658 650 (a) Suppose that the Wright meter is considered to provide a better measure of air flow, but the mini-Wright meter is easier to transport and to use. If the two types of meters produce different…arrow_forward
- The authors of the paper "Statistical Methods for Assessing Agreement Between Two Methods of Clinical Measurement"† compared two different instruments for measuring a person's ability to breathe out air. (This measurement is helpful in diagnosing various lung disorders.) The two instruments considered were a Wright peak flow meter and a mini-Wright peak flow meter. Seventeen people participated in the study, and for each person air flow was measured once using the Wright meter and once using the mini-Wright meter. Subject Mini-WrightMeter WrightMeter Subject Mini-WrightMeter WrightMeter 1 512 494 10 445 433 2 430 395 11 432 417 3 520 516 12 626 656 4 428 434 13 260 267 5 500 476 14 477 478 6 600 557 15 259 178 7 364 413 16 350 423 8 380 442 17 451 427 9 658 650 (a) Suppose that the Wright meter is considered to provide a better measure of air flow, but the mini-Wright meter is easier to transport and to use. If the two types of meters produce…arrow_forward4. Captopril is a drug designed to lower systolic blood pressure. When subjects were treated with this drug, their systolic blood pressure readings (in mm Hg) were measured before and after the drug was taken. Results are given in the accompanying table (based on data from “Essential Hypertension: Effect of an Oral Inhibitor of Angiotensin-Converting Enzyme”, by MacGregor et al., BMJ, Vol. 2). Using a 0.01 significance level, is there sufficient evidence to support the claim that captopril has an effect on systolic blood pressure? Explain why statistical methods from Z-interval, Z-test, T-interval or T-test –cannot be used for this problem. Then, use the sign test to conduct the required test in R studio. Please show your work.arrow_forwardCaptopril is a drug designed to lower systolic blood pressure. When subjects were treated with this drug, their systolic blood pressure readings (in mm Hg) were measured before and after the drug was taken. Results are given in the accompanying table (based on data from “Essential Hypertension: Effect of an Oral Inhibitor of Angiotensin-Converting Enzyme”, by MacGregor et al., BMJ, Vol. 2). Using a 0.01 significance level, is there sufficient evidence to support the claim that captopril has an effect on systolic blood pressure? i) Use the Wilcoxon signed-ranks test to conduct the required test without using "wilcox.test" function in R. Please state the hypothesis, provide the p-value, and the conclusion in the context of the problem. ii) Use the Wilcoxon signed-ranks test to conduct the required test using "wilcox.test" function in R. Please present a screenshot of the R output of your call to the function wilcox.test. iii) Would you recommend the Wilcoxon signed-ranks test over the…arrow_forward
arrow_back_ios
SEE MORE QUESTIONS
arrow_forward_ios
Recommended textbooks for you
 MATLAB: An Introduction with ApplicationsStatisticsISBN:9781119256830Author:Amos GilatPublisher:John Wiley & Sons Inc
 Probability and Statistics for Engineering and th...StatisticsISBN:9781305251809Author:Jay L. DevorePublisher:Cengage Learning
 Statistics for The Behavioral Sciences (MindTap C...StatisticsISBN:9781305504912Author:Frederick J Gravetter, Larry B. WallnauPublisher:Cengage Learning
 Elementary Statistics: Picturing the World (7th E...StatisticsISBN:9780134683416Author:Ron Larson, Betsy FarberPublisher:PEARSON
 The Basic Practice of StatisticsStatisticsISBN:9781319042578Author:David S. Moore, William I. Notz, Michael A. FlignerPublisher:W. H. Freeman
 Introduction to the Practice of StatisticsStatisticsISBN:9781319013387Author:David S. Moore, George P. McCabe, Bruce A. CraigPublisher:W. H. Freeman
MATLAB: An Introduction with Applications
Statistics
ISBN:9781119256830
Author:Amos Gilat
Publisher:John Wiley & Sons Inc
Probability and Statistics for Engineering and th...
Statistics
ISBN:9781305251809
Author:Jay L. Devore
Publisher:Cengage Learning
Statistics for The Behavioral Sciences (MindTap C...
Statistics
ISBN:9781305504912
Author:Frederick J Gravetter, Larry B. Wallnau
Publisher:Cengage Learning
Elementary Statistics: Picturing the World (7th E...
Statistics
ISBN:9780134683416
Author:Ron Larson, Betsy Farber
Publisher:PEARSON
The Basic Practice of Statistics
Statistics
ISBN:9781319042578
Author:David S. Moore, William I. Notz, Michael A. Fligner
Publisher:W. H. Freeman
Introduction to the Practice of Statistics
Statistics
ISBN:9781319013387
Author:David S. Moore, George P. McCabe, Bruce A. Craig
Publisher:W. H. Freeman
Mod-01 Lec-01 Discrete probability distributions (Part 1); Author: nptelhrd;https://www.youtube.com/watch?v=6x1pL9Yov1k;License: Standard YouTube License, CC-BY
Discrete Probability Distributions; Author: Learn Something;https://www.youtube.com/watch?v=m9U4UelWLFs;License: Standard YouTube License, CC-BY
Probability Distribution Functions (PMF, PDF, CDF); Author: zedstatistics;https://www.youtube.com/watch?v=YXLVjCKVP7U;License: Standard YouTube License, CC-BY
Discrete Distributions: Binomial, Poisson and Hypergeometric | Statistics for Data Science; Author: Dr. Bharatendra Rai;https://www.youtube.com/watch?v=lHhyy4JMigg;License: Standard Youtube License