
Concept explainers
Videos
Refer to the data of Exercise 6.11. A potential criticism of analyzing these data as if they were two independent samples is that the measurements taken in 1996 were taken at the same sites as the measurements taken in 1982. Thus, there is the possibility that there will be a strong
- a. Plot the pairs of observations in a
scatterplot with the 1982 values on the horizontal axis and the 1996 values on the vertical axis. Does there appear to be a positive correlation between the pairs of measurements? Estimate the correlation between the pairs of observations? - b. Compute the
correlation coefficient between the pairs of observations. Does this value confirm your observations from the scatterplot? Explain your answer. - c. Answer the questions posed in parts (a) and (b) of Exercise 6.11 using a paired data analysis. Are your conclusions different from the conclusions you reached treating the data as two independent samples?
6.11 PCBs have been in use since 1929, mainly in the electrical industry, but it was not until the 1960s that they were found to be a major environmental contaminant. In the paper “The Ratio of DDE to PCB Concentrations in Great Lakes Herring Gull Eggs and Its Use in Interpreting Contaminants Data” [Journal of Great Lakes Research (1998) 24(1):12–31], researchers report on the following study. Thirteen study sites from the five Great Lakes were selected. At each site, 9 to 13 herring gull eggs were collected randomly each year for several years. Following collection, the PCB content was determined. The mean PCB content at each site is reported in the following table for the years 1982 and 1996.
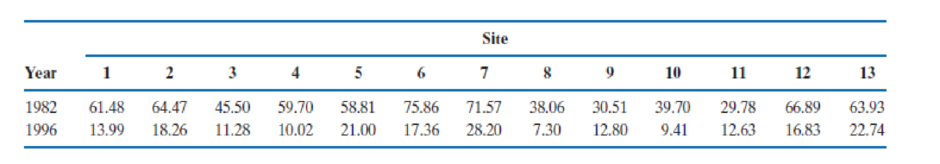
- a. Legislation was passed in the 1970s restricting the production and use of PCBs. Thus, the active input of PCBs from current local sources has been severely curtailed. Do the data provide evidence that there has been a significant decrease in the mean PCB content of herring gull eggs?
- b. Estimate the size of the decrease in mean PCB content from 1982 to 1996, using a 95% confidence interval.
- c. Evaluate the conditions necessary to validly test the hypotheses and construct the confidence intervals using the collected data.
- d. Does the independence condition appear to be violated?
Want to see the full answer?
Check out a sample textbook solution
Chapter 6 Solutions
An Introduction to Statistical Methods and Data Analysis


 Calculus For The Life SciencesCalculusISBN:9780321964038Author:GREENWELL, Raymond N., RITCHEY, Nathan P., Lial, Margaret L.Publisher:Pearson Addison Wesley,
 Glencoe Algebra 1, Student Edition, 9780079039897...AlgebraISBN:9780079039897Author:CarterPublisher:McGraw Hill
 Big Ideas Math A Bridge To Success Algebra 1: Stu...AlgebraISBN:9781680331141Author:HOUGHTON MIFFLIN HARCOURTPublisher:Houghton Mifflin Harcourt
 Holt Mcdougal Larson Pre-algebra: Student Edition...AlgebraISBN:9780547587776Author:HOLT MCDOUGALPublisher:HOLT MCDOUGAL