
Graph showing a
Explanation of Solution
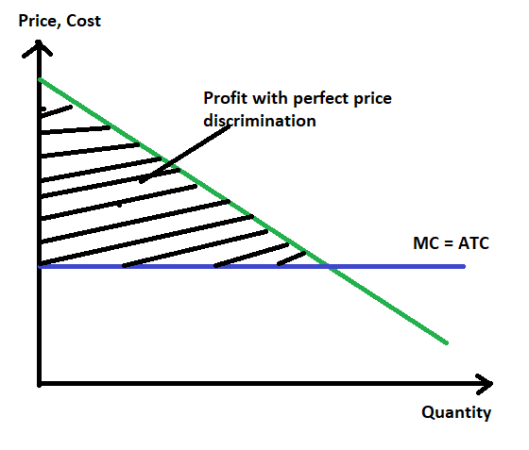
The above diagram shows the perfect price-discrimination monopolist diagram in which ATC is the average total cost which is horizontal, D is the demand curve which is downward sloping and the shaded area is the profit of the monopolist. Since it is perfect price discrimination, the monopolist charges a price equal to the maximum willingness to pay of all groups of consumers and leaves zero
When a monopolist charges a different price to different groups of consumers to their maximum willingness to pay, it is called perfect price discrimination. In perfect price discrimination, monopolists extract all consumer surplus.
Chapter 63 Solutions
Krugman's Economics For The Ap® Course


 Principles of Economics (12th Edition)EconomicsISBN:9780134078779Author:Karl E. Case, Ray C. Fair, Sharon E. OsterPublisher:PEARSON
 Engineering Economy (17th Edition)EconomicsISBN:9780134870069Author:William G. Sullivan, Elin M. Wicks, C. Patrick KoellingPublisher:PEARSON
 Principles of Economics (MindTap Course List)EconomicsISBN:9781305585126Author:N. Gregory MankiwPublisher:Cengage Learning
 Managerial Economics: A Problem Solving ApproachEconomicsISBN:9781337106665Author:Luke M. Froeb, Brian T. McCann, Michael R. Ward, Mike ShorPublisher:Cengage Learning
 Managerial Economics & Business Strategy (Mcgraw-...EconomicsISBN:9781259290619Author:Michael Baye, Jeff PrincePublisher:McGraw-Hill Education