
Videos
To plot: The graph of the given inequality.
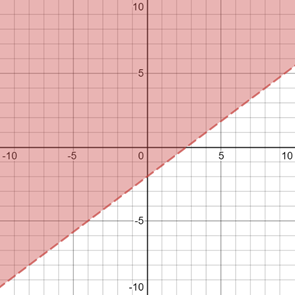
Answer to Problem 74S
The graph of the given inequality is given below.
Explanation of Solution
Given:
The given inequality function is:
The domain of the inequality is
The table for the graph of the function
The graph of the given inequality function is given by:
Because
Check:
Select a point in the shaded region and verify it is a solution of the inequality.
Test for the point
Chapter 6 Solutions
Glencoe Algebra 2 Student Edition C2014
Additional Math Textbook Solutions
Linear Algebra and Its Applications (5th Edition)
College Algebra (7th Edition)
College Algebra
College Algebra
Thinking Mathematically (7th Edition)


 Algebra and Trigonometry (6th Edition)AlgebraISBN:9780134463216Author:Robert F. BlitzerPublisher:PEARSON
 Contemporary Abstract AlgebraAlgebraISBN:9781305657960Author:Joseph GallianPublisher:Cengage Learning
 Linear Algebra: A Modern IntroductionAlgebraISBN:9781285463247Author:David PoolePublisher:Cengage Learning
 Algebra And Trigonometry (11th Edition)AlgebraISBN:9780135163078Author:Michael SullivanPublisher:PEARSON
 Introduction to Linear Algebra, Fifth EditionAlgebraISBN:9780980232776Author:Gilbert StrangPublisher:Wellesley-Cambridge Press
 College Algebra (Collegiate Math)AlgebraISBN:9780077836344Author:Julie Miller, Donna GerkenPublisher:McGraw-Hill Education