
Concept explainers
Videos
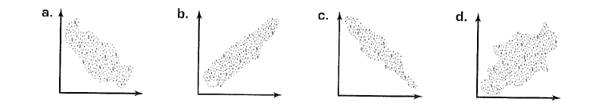
To find: the data showing the strong
Answer to Problem 71E
Graph (b)
Explanation of Solution
Given information:
The four
Calculation:
Since the points in graph (a) and (c) are falling down on moving from left to right. Thus scatter plot (a) and (c) shows
Since the points in graph (b) and (d) are rising on moving from left to right. Thus scatter plot (b) and (d) shows positive correlation. This shows that the values of one variable are increasing with respect to another.
The graph (b) has less scattered points and forms almost perfect straight line as compared to graph (d). Thus graph (b) represents the strong positive correlation.
Chapter 6 Solutions
Advanced Mathematical Concepts: Precalculus with Applications, Student Edition
Additional Math Textbook Solutions
Precalculus (10th Edition)
Calculus: Early Transcendentals (2nd Edition)
Thomas' Calculus: Early Transcendentals (14th Edition)
Calculus: Early Transcendentals (3rd Edition)
Single Variable Calculus: Early Transcendentals (2nd Edition) - Standalone book


 Calculus: Early TranscendentalsCalculusISBN:9781285741550Author:James StewartPublisher:Cengage Learning
 Thomas' Calculus (14th Edition)CalculusISBN:9780134438986Author:Joel R. Hass, Christopher E. Heil, Maurice D. WeirPublisher:PEARSON
 Calculus: Early Transcendentals (3rd Edition)CalculusISBN:9780134763644Author:William L. Briggs, Lyle Cochran, Bernard Gillett, Eric SchulzPublisher:PEARSON
 Calculus: Early TranscendentalsCalculusISBN:9781319050740Author:Jon Rogawski, Colin Adams, Robert FranzosaPublisher:W. H. Freeman
 Calculus: Early Transcendental FunctionsCalculusISBN:9781337552516Author:Ron Larson, Bruce H. EdwardsPublisher:Cengage Learning