
Concept explainers
Videos
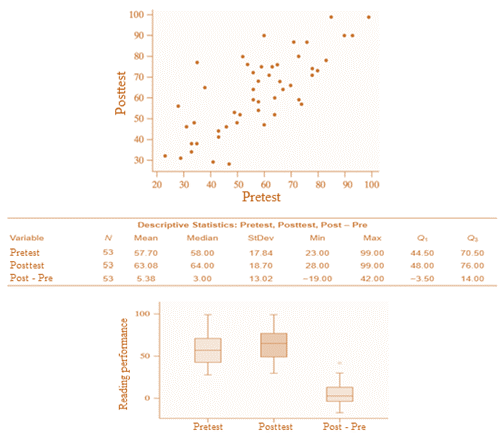
(a)
Equation of the least squares regression line relating posttest and pretest scores.
(a)
Answer to Problem 36E
Equation of the least squares regression line,
Explanation of Solution
Given information:
For the least − squares regression line,
General equation:
From the computer output,
The estimate of the slope b1 is provided in the column “Coef” and in the row “Pretest”:
Also,
The estimate of the slope b0 is provided in the column “Coef” and in the row “Constant”:
Thus,
In the general equation of the least − squares regression line,
Replace b1 by 0.78301 and b0 by 17.897:
Where,
x represents the Pretest score.
y represents the Posttest score.
(b)
Whether a linear model is appropriate for describing this relationship.
(b)
Answer to Problem 36E
Yes, a linear model is appropriate for describing this relationship.
Explanation of Solution
Given information:

In this case,
There is no strong curvature present in the
Also,
No strong curvature present in the residual plot.
Moreover,
The points in the residual plot appear to be randomly scattered.
Also,
There appear to be no strong outliers (points that deviate strongly from the pattern in the other points).
Thus,
The model does indeed appear to be appropriate.
(c)
Typical predictions while using the least − square regression line to predict students’ posttest scores from their pretest scores.
(c)
Answer to Problem 36E
The predicted posttest score deviates on an average by 12.55 points from the actual posttest score.
Explanation of Solution
Given information:

In the computer output,
The standard error of the estimate s is given after “S=”.
Such that
The standard deviation of the residual or the standard error of the estimate ( s ) represents the average error of predictions.
Thus,
This shows average deviation between actual y − values and the predicted y − values.
Thereby,
Using the equation of the least − squares regression line,
The predicted posttest score deviates on an average by 12.55 points from the actual posttest score.
Chapter 6 Solutions
PRACTICE OF STATISTICS F/AP EXAM
Additional Math Textbook Solutions
Basic Business Statistics, Student Value Edition
Statistics: The Art and Science of Learning from Data (4th Edition)
Statistics for Business and Economics (13th Edition)
Introductory Statistics (10th Edition)
Elementary Statistics: Picturing the World (6th Edition)
Fundamentals of Statistics (5th Edition)


 MATLAB: An Introduction with ApplicationsStatisticsISBN:9781119256830Author:Amos GilatPublisher:John Wiley & Sons Inc
 Probability and Statistics for Engineering and th...StatisticsISBN:9781305251809Author:Jay L. DevorePublisher:Cengage Learning
 Statistics for The Behavioral Sciences (MindTap C...StatisticsISBN:9781305504912Author:Frederick J Gravetter, Larry B. WallnauPublisher:Cengage Learning
 Elementary Statistics: Picturing the World (7th E...StatisticsISBN:9780134683416Author:Ron Larson, Betsy FarberPublisher:PEARSON
 The Basic Practice of StatisticsStatisticsISBN:9781319042578Author:David S. Moore, William I. Notz, Michael A. FlignerPublisher:W. H. Freeman
 Introduction to the Practice of StatisticsStatisticsISBN:9781319013387Author:David S. Moore, George P. McCabe, Bruce A. CraigPublisher:W. H. Freeman