
Concept explainers
Videos
Uniform Distribution: Measurement Errors Measurement errors from instruments are often modeled using the uniform distribution (see Problem 16). To determine the
- (a) less than +0.03 microsecond (i.e., −0.05 ≤ x < 0.03)?
- (b) more than −0.02 microsecond?
- (c) between −0.04 and +0.01 microsecond?
- (d) Find the mean and standard deviation of measurement errors. Measurements from an instrument are called unbiased if the mean of the measurement errors is zero. Would you say the measurements for these acoustical sensors are unbiased? Explain.
16. Expand Your Knowledge: Continuous Uniform Probability Distribution Let α and β be any two constants such that α < β. Suppose we choose a point x at random in the interval from α to β. In this context the phrase at random is taken to mean that the point x is as likely to be chosen from one particular part of the interval as any other part. Consider the rectangle.
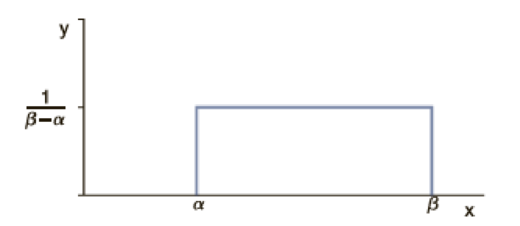
The base of the rectangle has length β − α and the height of the rectangle is 1/(β − α), so the area of the rectangle is 1. As such, this rectangle’s top can be thought of as part of a probability density curve. Since we specify that x must lie between α and β, the probability of a point occurring outside the interval [α, β] is, by definition, 0. From a geometric point of view, x chosen at random from α to β means we are equally likely to land anywhere in the interval from α to β. For this reason, the top of the (rectangle’s) density curve is flat or uniform.
Now suppose that a and b are numbers such that α ≤ a < b ≤ β. What is the probability that a number x chosen at random from α to β will fall in the interval [a, b]? Consider the graph
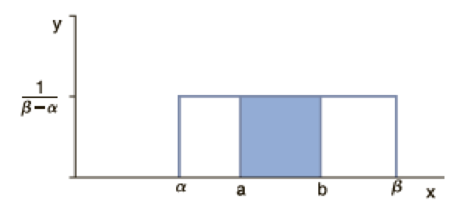
Because x is chosen at random from [α, β], the area of the rectangle that lies above [a, b] is the probability that x lies in [a, b]. This area is
In this way we can assign a probability to any interval inside [α, β]. This probability distribution is called the continuous uniform distribution (also called the rectangular distribution). Using some extra mathematics, it can be shown that if x is a random variable with this distribution, then the mean and standard deviation of x are
Sedimentation experiments are very important in the study of biology, medicine, hydrodynamics, petroleum engineering, civil engineering, and so on. The size (diameter) of approximately spherical particles is important since larger particles hinder and sometimes block the movement of smaller particles. Usually the size of sediment particles follows a uniform distribution (Reference: Y. Zimmels, “Theory of Kindred Sedimentation of Polydisperse Mixtures,” AIChE Journal, Vol. 29, No. 4, pp. 669–676).
Suppose a veterinary science experiment injects very small, spherical pellets of low-level radiation directly into an animal’s bloodstream. The purpose is to attempt to cure a form of recurring cancer. The pellets eventually dissolve and pass through the animal’s system. Diameters of the pellets are uniformly distributed from 0.015 mm to 0.065 mm. If a pellet enters an artery, what is the probability that it will be the following sizes?
- (a) 0.050 mm or larger. Hint: All particles are between 0.015 mm and 0.065 mm, so larger than 0.050 means 0.050 ≤ x ≤ 0.065.
- (b) 0.040 mm or smaller
- (c) between 0.035 mm and 0.055 mm
- (d) Compute the mean size of the particles.
- (e) Compute the standard deviation of particle size.
Want to see the full answer?
Check out a sample textbook solution
Chapter 6 Solutions
Understandable Statistics: Concepts and Methods


- Mating parts are shown in Figure 29-16. The pins in the top piece fit into the holes in the bottom piece. All dimensions are in inches. Determine the following; a. The mean pin diameters b. The mean hole diameters c. The maximum dimension A d. The minimum dimension A e. The maximum dimension B f. The minimum dimension B g. The maximum total clearance between dimension C and dimension D h. The minimum total clearance between dimension C and dimension Darrow_forwardProblem 7 A new formulation of concrete has been designed for a particular building application. Naturally, the strength of concrete produced with the new formulation had to be tested for its strength capability. The compressive strength of 12 specimens were tested, as shown below. 2216 2281 2237 2263 2249 2318 2204 2255 2225 2275 2301 2295 a. With a simple histogram, draw conclusions about the normality of these observations. Assume normality regardless. b. Calculate a 95% confidence interval for mean compressive strength. c. Calculate a 95% confidence interval for standard deviation of compressive strength.arrow_forwardChapter 09, Section 9.2, Problem 029a Lazurus Steel Corporation produces iron rods that are supposed to be 36 inches long. The machine that makes these rods does not produce each rod exactly 36 inches long. The lengths of the rods are normally distributed and vary slightly. It is known that when the machine is working properly, the mean length of the rods is 36 inches. The standard deviation of the lengths of all rods produced on this machine is always equal to 0.035 inch. The quality control department at the company takes a sample of 20 such rods every week, calculates the mean length of these rods, and tests the null hypothesis, µ = 36 inches, against the alternative hypothesis, u # 36 inches. If the null hypothesis is rejected, the machine length of 36.015 inches. stopped and adjusted. A recent sample of 20 rods produced a mean Calculate the p-value for this test of hypothesis. Based on this p-value, will the quality control inspector decide to stop the machine and adjust it if he…arrow_forward
- One operation of a mill is to cut pieces of steel into parts that will later be used as the frame for front seats in an automobile. The steel is cut with a diamond saw and requires the resulting parts to be within 10.005 inch of the length specified by the automobile company. Data are collected from a sample of 50 steel parts and are shown in the following table. The measurement reported is the difference in inches between the actual length of the steel part, as measured by a laser measurement device, and the specified length of the steel part. For example, the first value, -0.003, represents a steel part that is 0.003 inch shorter than the specified length. Complete parts a through c Click the icon to view the data table. a. Construct a frequency distribution Difference in Length -0.005 but less than -0.003: -0.003but less than -0.001 -0.001but less than 0.001 0.001but less than 0.003 0.003but less than 0.005 Frequency Difference Between Actual and Specified Lengths 0.002 0 -0.003…arrow_forwardfrom the data in question 5, find the estimate for the modearrow_forwardThe manufacturing company in problem 3.60 also produces electric insulators. If the insulators break when in use, a short circuit is likely to occur. To test the strength of the insulators, destructive testing is carried out to determine how much force is required to break the insulators. Force is measured by observing how many pounds must be applied to an insulator before it breaks. Data are collected from a sample of 30 insulators. The file contains the strengths, as follows: 1,870 1,728 1,656 1,610 1,634 1,784 1,522 1,696 1,592 1,662 1,866 1,764 1,734 1,662 1,734 1,774 1,550 1,756 1,762 1,866 1,820 1,744 1,788 1,688 1,810 1,752 1,680 1,810 1,652 1,736 a. Compute the mean, median, range, and standard deviation for the force needed to break the insulators. Show your working. b. Interpret the measures of central tendency and variability in (a).arrow_forward
- lili .... OFF References Mailings Review View >> Tell me Sh Draw Design Layout 12 AA Aa v ibri (Bo... 三 三三三E Styles Dictate Create x A - 130 adults with gum disease were asked the number of times per week they used to floss before their diagnoses. The (incomplete) results are shown below: # of times floss per week Frequency Relative Frequency Cumulative Frequency 15 0.1154 33 1. 0.1385 51 2. 81 0.0769 3. 15 0.1154 4. 17 0.1308 93 5. 0.1538 113 6. 0.1308 130 7. a. Complete the table (Use 4 decimal places when applicable) b. What is the cumulative relative frequency for flossing 3 times per week? % English (United States) spioM 06 Focus JAN 13arrow_forwardProblem Set Chpt. 8 Search Layout Table Design Help View Mailings Review ences 2 T Aa A EE E A AaBbCcDc AaBbCcDc AaBbC AaßbCcC Heading 2 1No Spac... Heading 1 M Normal A D Styles Paragraph Wiki Pages for Frequency Distributions MATH 113: Section 8.2a Name Sisscon is a phone answering service. The following data are the numbers of calls per day Heported by the company for the last month. 13 14 21 62 23 22 21 27 63 44 41 11 62 78 32 72 64 10 73 16 22 13 39 43 20 55 53 66 24 37 52 38 70 45 32 1. Create a grouped frequency distribution for the data using 8 classes and then use it to answer the following questions. Let the first lower class limit be 0 and the class width be 10 (which means the first upper class limit is 9). 1S e Warrow_forwardIllustration 11.16. Calculate quartile coofficient of skewness from the following: Weight No. of persons c.f. Under 100 1 1 100-109 14 15 110-119 66 81 120-129 122 203 130-139 145 348 140-149 121 409 150-159 65 534 160-169 31 565 170-179 12 577 180-189 5 582 190-199 584 200 and above 586arrow_forward
 Mathematics For Machine TechnologyAdvanced MathISBN:9781337798310Author:Peterson, John.Publisher:Cengage Learning,