
Microeconomics (2nd Edition) (Pearson Series in Economics)
2nd Edition
ISBN: 9780134492049
Author: Daron Acemoglu, David Laibson, John List
Publisher: PEARSON
expand_more
expand_more
format_list_bulleted
Question
Chapter 6, Problem 8Q
To determine
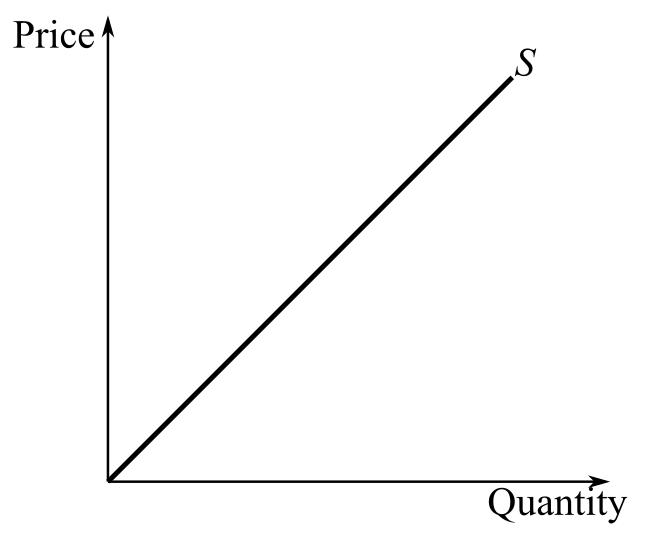
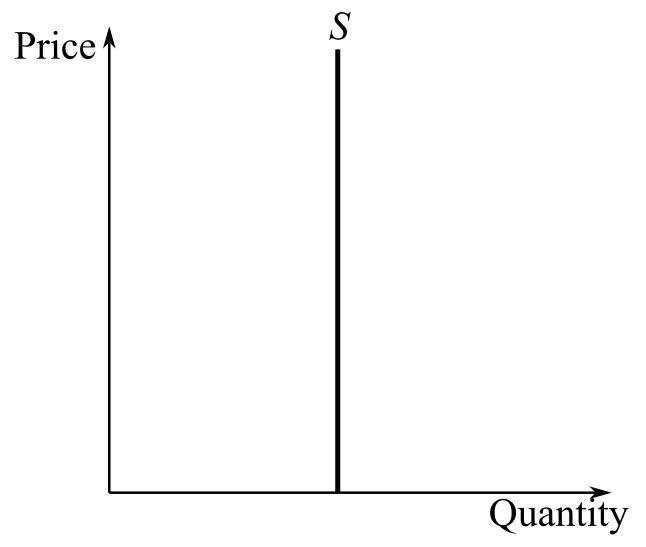
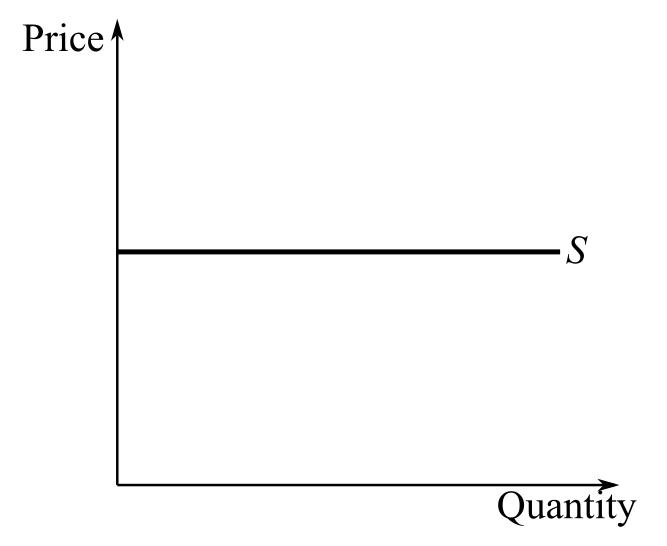
Elasticity of supply in the following curves:
(a)
(b)
(c)
Expert Solution & Answer
Want to see the full answer?
Check out a sample textbook solution
Students have asked these similar questions
The following figure depicts the supply curve of a certain firm.
Price
70
60
50
40
30
20
10
0
0
Refer to the figure above. If the elasticity of supply is 0.5 when the quantity changes from 100 to 150,
what is the price at the quantity 100?
$2,50
$4
$5
50 100 150 200 250 300 Quantity
$6
The elasticity of Supply is an important concept in Microeconomics as it relates to a business's ability to adjust its production and its production facility in response to market developments. Think of some examples of products and businesses that would have various degrees of Elasticity of Supply and share them here.
For example, what would be the Elasticity of Supply for an original piece of art? What does this imply for the adjustment in this market to a change in Demand?
How would you describe the Elasticity of Supply for a product such as peaches, plums, and other tree fruit? Consider first a brief period, such as weeks, and next a much longer period such as five years. How does the time horizon influence market adjustment when there is a change in Demand?
Blue Co. makes a processor that requires a metal that can only be found in a single mine in Peru. Do you expect the price elasticity of supply for this processor to be elastic or inelastic? Explain in 1-4 sentences.
Chapter 6 Solutions
Microeconomics (2nd Edition) (Pearson Series in Economics)
Knowledge Booster

Similar questions
- In 50 words, answer the following question: We know that a linear supply curve starting from the origin represent the constant price elasticity of supply. (You can examine it with some numerical examples.) Why don't we find any linear demand curves representing constant price elasticity of demand?arrow_forwardWhat can be said about the price elasticity of demand in each of the following statements? “The Tikka delivery business in this town is very competitive. I’d lose half my customers if I raised the price by as little as 10%.” “My economics professor has chosen to use the Mankiw textbook for this class. I have no choice but to buy this book.” “I always spend a total of exactly Rs.1000 per week on coffee.” A news website reported (Feb. 17, 2020) that ridership of Karachi Metro Bus declined after a fare increase: “There were nearly four million fewer riders in December 2019, the first full month after the price of a token increased Rs. 25 to Rs.150, than in the previous December, a 4.3 percent decline.” Use these data to estimate the price elasticity of demand for Karachi Metro Bus. According to your estimate, what happens to the Karachi Metro Bus’s revenue when the fare rises? Why might your estimate of the elasticity be unreliable?arrow_forwardQ.8. What can you conclude about the price elasticity of demand in each of the following statements? “The pizza delivery business in this town is very competitive. I’d lose half my customers if I raised the price by as little as 10%.” “I owned both of the two Jerry Garcia autographed lithographs in existence. I sold one on eBay for a high price. But when I sold the second one, the price dropped by 80%.” “My economics professor has chosen to use the Krugman/Wells textbook for this class. I have no choice but to buy this book.” “I always spend a total of exactly $10 per week on coffee.”arrow_forward
- XYZ Co. makes a processor that requires a metal that can be found in a single mine in Peru. Do you expect the price elasticity of supply for this processor to be elastic or inelastic? Explain your answer in approximately 1-4 sentences.arrow_forwardConsider a company, StarBreads, that sells bread in a competitive market. The price of bread is currently $3 per loaf, and StarBreads is selling 1000 loaves per day. The company decides to increase the price to $4 per loaf, and as a result, daily sales drop to 800 loaves. Calculate the price elasticity of demand for StarBreads' loaves using the midpoint method.arrow_forwardThe data in the table shows the price and quantity supplied for exercise balls. Using the Midpoint Method, what is the price elasticity of supply from point C to point D? Note: Remember to take the absolute value of the result and round to the nearest hundredth. If using a calculator, rounding should be done at the end of your calculation. Provide your answer below: Point Price $30 A B C D E $32 834 $3 $38 Quantity 10,000 10, 100 10,200 10,300 10,040arrow_forward
- What is the formula for measuring the price elasticity of supply? Suppose the price of apples goes up from $20 to $22 a box. In direct response, Goldsboro Farms supplies 1200 boxes of apples instead of 1000 boxes. Compute the coeffificient of price elasticity (midpoints approach) for Goldsboro’s supply. Is its supply elastic, or is it inelastic?arrow_forwardExplain classification of linear supply functions by types of elasticities.arrow_forwardA farmer produced 8400 tons of grapes and each ton sales for $200. Grapes are found to be a perfect cure for Corona Virus. As a result, the price of grapes went from $200 per ton to $10,000 per ton. How many tons will the farmer sale? Using your knowledge of price elasticity of supply, draw a graph illustrating this sale. What will happen in the market for grapes in one year if the price hold steady at $10, 000. Draw a graph showing this.arrow_forward
- The equation for a supply curve is P = 3Q - 8. What is the elasticity in moving from a price of 4 to a price of 7? You must show your calculations.arrow_forwardHow is it possible for the elasticity of demand to change over time (in the long run)? Explain.arrow_forwardOmari's HookNLadder is the only company selling fire engines in the fictional country of Alexandrina. Omari initially produced eight trucks, but then decided to increase production to nine trucks. The following graph gives the demand curve faced by Omari's HookNLadder. As the graph shows, in order to sell the additional fire truck, Omari must lower the price from $80,000 to $40,000 per truck. Notice that Omari gains revenue from the sale of the additional engine, but at the same time, he loses revenue from the initial eight engines because they are all sold at the lower price. Use the purple rectangle (diamond symbols) to shade the area representing the revenue lost from the initial eight engines by selling at $40,000 rather than $80,000. Then use the green rectangle (triangle symbols) to shade the area representing the revenue gained from selling an additional engine at $40,000. PRICE (Thousands of dollars per fire engine) 220 200 180 160 140 120 100 80 60 40 20 0 Omari 0 1 + 2 3 4 5…arrow_forward
arrow_back_ios
SEE MORE QUESTIONS
arrow_forward_ios
Recommended textbooks for you


