
Microeconomics (2nd Edition) (Pearson Series in Economics)
2nd Edition
ISBN: 9780134492049
Author: Daron Acemoglu, David Laibson, John List
Publisher: PEARSON
expand_more
expand_more
format_list_bulleted
Question
Chapter 6, Problem 12Q
To determine
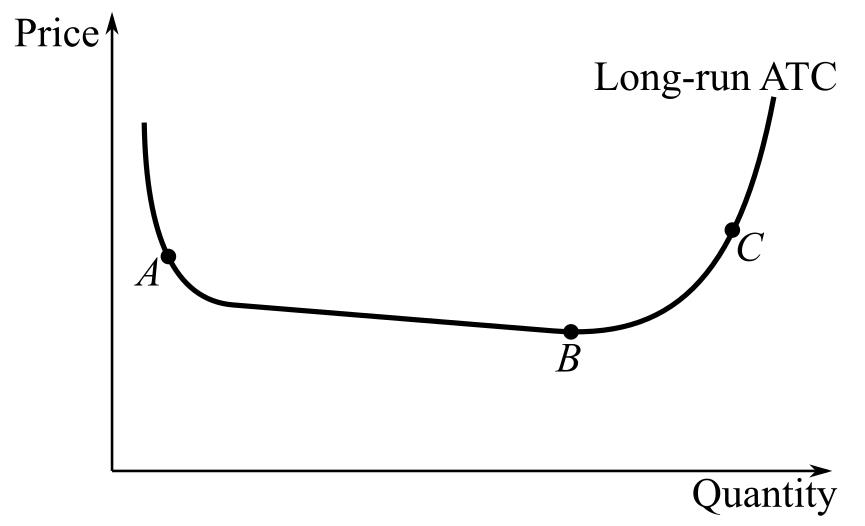
The economies of scale, constant returns to scale and diseconomies of scale in the following diagram:
Expert Solution & Answer
Want to see the full answer?
Check out a sample textbook solution
Students have asked these similar questions
The graph below shows the marginal cost (MC), average variable cost (AVC), and average total cost (ATC) curves for a firm in a
competitive market. These curves imply a short-run supply curve that has two distinct parts. One part, not shown, lies along the vertical
axis (quantity-0); this represents a condition of production shutdown. Where is the other part? Use the straight-line tool to drawit.
To refer to the graphing tutorial for this question type, please click here
Price and cost
18
15
14
13
12
10
19/21
SUBMIT ANSWER
13 OF 21 QUESTIONS C
OMPLETED
28
MacBook Pro
금□
F7
F8
F9
F1o
F2
F3
F5
The following graph shows the demand curve, as well as the AVC, ATC and MC curves of a company selling rolled oats in a perfectly competitive market. Use the graph to answer the questions.
The goal of the company is to maximize its profit. How many boxes of rolled oats should it sell to attain this goal? What price will it charge?
How much profit does this firm make per month?
Will this company produce or shut down in the short run? Why?
Will this firm exit the market for rolled oats in the long run or not? Why?
The accompanying graph depicts the cost curves of an individual firm in a perfectly (or purely) competitive industry.
Chapter 6 Solutions
Microeconomics (2nd Edition) (Pearson Series in Economics)
Knowledge Booster

Similar questions
- According to the accompanying table, what quantity of output should the firm produce? Explain your answer.arrow_forwardDo fixed costs affect perfectly competitive firm’s output decisions in the short run? Briefly explain your answer. Are there fixed costs in the long run? Do fixed costs affect perfectly competitive firm’s output decisions in the long run? Explain your answers briefly.arrow_forwardA perfectly competitive firm is currently maximizing profits. The market for its product is in a long-run equilibrium. Market demand for the product decreases. Briefly explain what happens in the market by describing what will happen to this firm’s production (and most importantly why) as a result of that change. Describe what will happen and why to the firm’s costs and profits as the firm makes its choices. Emphasize why each type of individual cost does or does not change as the firm changes its level of production.arrow_forward
- Please answer all parts: How does fixed cost affect marginal cost? Do fixed costs affect perfectly competitive firm’s output decisions in the short run? Briefly explain your answer. Are there fixed costs in the long run? Do fixed costs affect perfectly competitive firm’s output decisions in the long run? Explain your answers briefly.arrow_forwardWhat is the relationship between marginal cost and the short-run supply curve for the purely competitive firm?arrow_forwardSuppose that the market for microwave ovens is a competitive market. The following graph shows the daily cost curves of a firm operating in this market. Hint: After placing the rectangle on the graph, you can select an endpoint to see the coordinates of that point.arrow_forward
- Suppose Felix runs a small business that manufactures frying pans. Assume that the market for frying pans is a perfectly competitive market, and the market price is $20 per frying pan. The following graph shows Felix's total cost curve.arrow_forwardGiven the information from the graph below, draw the cost curve of the firm showing the minimum costs corresponding to the level of output.arrow_forwardRelated to the Economics in Practice on page 195: If firms have long-run average cost curves with a long, flat section, larger firms have a cost advantage over smaller firms. the optimal number of firms in the industry is one. their long run supply curves are downward sloping. it is impossible to predict the size of the firm.arrow_forward
- Homework (Ch 14) 6. Deriving the short-run supply curve Consider the competitive market for dress shirts. The following graph shows the marginal cost (MC), average total cost (ATC), and average variable cost (AVC) curves for a typical firm in the industry. 100 90 80 70 60 АТС 50 40 30 20 AVC MC O 10 25 30 35 40 45 50 5 10 15 20 QUANTITY (Thousands of shirts) COSTS (Dollars)arrow_forwardConsider the competitive market for dress shirts. The following graph shows the marginal cost (MC), average total cost (ATC), and average variable cost (AVC) curves for a typical firm in the industry. COSTS (Dollars) 100 90 80 70 60 30 20 10 0 0 ☐ 3 MC 6 15, 20 ATC AVC 0 9 12 15 18 21 QUANTITY (Thousands of shirts) 24 27 1 30 (?)arrow_forward(? 100 90 80 70 60 ATC 50 40 30 20 AVC 10 MC 0 5 10 15 20 25 30 35 40 45 50 QUANTITY (Thousands of jackets) COSTS (Dollars)arrow_forward
arrow_back_ios
SEE MORE QUESTIONS
arrow_forward_ios
Recommended textbooks for you

 Economics (MindTap Course List)EconomicsISBN:9781337617383Author:Roger A. ArnoldPublisher:Cengage Learning
Economics (MindTap Course List)
Economics
ISBN:9781337617383
Author:Roger A. Arnold
Publisher:Cengage Learning