
Concept explainers
Videos
Golfing The data below represent the expected percentage of putts that will be made by professional golfers on the PGA Tour depending on distance. For example, it is expected that of 2-foot putts will be made.
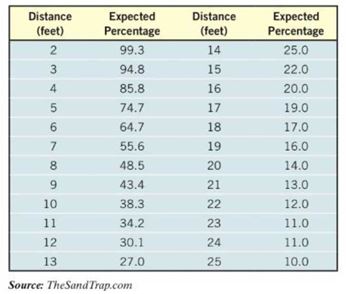
(a) Using a graphing utility, draw a
(b) Based on the scatter diagram drawn in part (a), decide on a model (linear, quadratic, cubic, exponential, logarithmic, or logistic) that you think best describes the relation between distance and expected percentage. Be sure to justify your choice of model.
(c) Using a graphing utility, find the model of best fit.
(d) Graph the function found in part (c) on the scatter diagram.
(e) Use the function found in part (c) to predict what percentage of 30-foot putts will be made.
Want to see the full answer?
Check out a sample textbook solution
Chapter 5 Solutions
Precalculus


 Glencoe Algebra 1, Student Edition, 9780079039897...AlgebraISBN:9780079039897Author:CarterPublisher:McGraw Hill
 Big Ideas Math A Bridge To Success Algebra 1: Stu...AlgebraISBN:9781680331141Author:HOUGHTON MIFFLIN HARCOURTPublisher:Houghton Mifflin Harcourt
 Holt Mcdougal Larson Pre-algebra: Student Edition...AlgebraISBN:9780547587776Author:HOLT MCDOUGALPublisher:HOLT MCDOUGAL