
Videos
To review:
The relative medullary thickness (RMT) is a good predictor to determine an animal’s ability to produce concentrated urine or not, based on an RMT vs freezing point depression (FPD) plot.
Given:
The RMT and the FPD for different mammals are given in the Table 1:
Table 1: The RMT and FPD of different mammals.
| Animal | RMT | FPD (ᵒC) |
| Beaver | 1.3 | 0.96 |
| Pig | 1.6 | 2 |
| Human | 3 | 2.6 |
| Dog | 4.3 | 4.85 |
| Cat | 4.8 | 5.8 |
| Lab rat | 5.8 | 4.85 |
| Kangaroo rat | 8.5 | 10.4 |
| Jerboa | 9.3 | 12 |
| Sand rat | 10.7 | 9.2 |
Introduction:
RMT refers to the thickness of medulla of the kidney divided by volume (length X width X thickness) of the entire kidney. FPD is a test, which is used to measure the concentration of urine. It is known that fresh water freezes at 0°C, but the addition of solutes lowers this freezing temperature.
Explanation of Solution
The graph plot between RMT and FPD is given in the Figure 1.
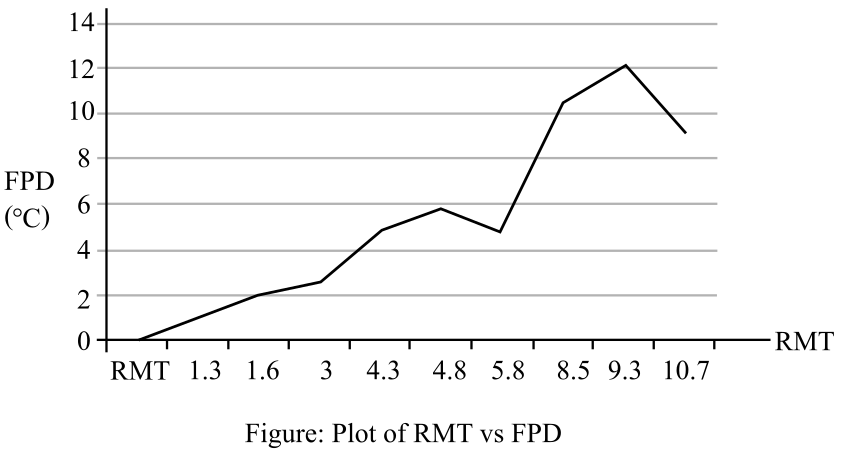
Figure 1: Plot of RMT vs FPD.
It can be observed from the graph that as the RMT increases, the FPD also increases. This means that the concentration of the urine increases with an increase in relative length of loops of Henle. The graph follows an almost linearly increasing trend.
A slight deviation from the trend is observed in case of the laboratory rat and the sand rat.
Therefore, it can be concluded that the RMT is a good predictor of the ability of the mammal to produce concentrated urine.
Want to see more full solutions like this?
Chapter 51 Solutions
LIFE:SCIENCE OF BIOL.(LL) >CUSTOM<


- For NUMBERS 71-80, decide how the following conditions would affect the physiology of the Urinary System. Choices are A Increase B Decrease C Stay the same 71. As sympathetic stimulation of the kidneys decreases, the renal reabsorption of sodium will 72. As aldosterone secretion increases, plasma [K +]will 73. As the volume of urine within the bladder exceeds 200 mL, the smooth muscle tension generated by the internal urethral sphincter will 74. In response to an decrease in blood pressure, the diameter of the afferent arteriole to will 75. ADH causes the osmolarity of urine to 76. Angiotensin II causes systemic blood pressure to 77. As blood travels from the interlobular artery to the interlobular vein, its creatinine content will filtrate travels from the capsular space to the loop of Henle, its glucose content will filtration membrane would cause the protein content of urine to inflammation of the renal cortex. As the body responds, antigen-antibody complexes accumulate between the…arrow_forwardAn athlete tested positive for Methylhexaneamine in urine with a level of 0.90 µg/mL. At her appeal in the Court of Arbitration, she quotes a highly respected scientific publication that states that at levels of 1.0 µg/mL there is no performance enhancement. If the athlete’s levels are indeed below this threshold, the athlete can face a year’s suspension instead of a ban for life. Use the Estimate of Uncertainty to determine if the Athlete should be given a 1 year suspension or banned for life.arrow_forwardIn IBD1, if 20 mg of a drug is ultimately excreted unchanged into urine, the amount of the drug excreted unchanged into urine after 2 half-lives is _____ mg. Round the answer into the nearest integer.arrow_forward
- The osmotic concentration of seawater is approximately 1,000 mOsmol L-¹. Which of the following marine vertebrates can drink seawater without becoming dehydrated? A. A bony fish such as the flounder (maximum urine osmolarity = 340 mOsmol L-¹) B. A marine bird such as an albatross (maximum urine osmolarity ≈ 640 mOsmol L-¹) C. A marine reptile such as a loggerhead turtle (maximum urine osmolarity ≈ 320 mOsmol L-¹) D. A marine mammal such as a whale (maximum urine osmolarity ≈ 1,920 mOsmol L-¹) E. All of the abovearrow_forwardIn the experiment of the impacts of sedative and hypnotic acivities in MEJP leaves, does the different behavioral models in mice are the independent variables while the amount of dosage is the dependent variables?arrow_forwardWhat would be the effect of a loss of function mutation in the aquaporin 2 gene? O a. No aldosterone-regulated water reabsorption from the cortical collecting ducts No aldosterone-regulated water reabsorption from the ascending limb of the loop of Henle С. No aldosterone-regulated water reabsorption from the descending limb of the loop of Henle o d. No effect due to the redundancy in the functions of aquaporin 2 and 3 е. No water reabsorption will occur in the kidneyarrow_forward
- Why the usual daily lodin requirement for an averge male is 140 micrograms and ?female about 100 microgramarrow_forwardCalculate the creatinine clearance for Lola, a 69 year old woman who weighs 66kg and has a serum creatinine of 125micromoles/L. Round your answer to 2 decimal places Cockroft Gault equation: [ X (140-age) x (weight in kg)] / serum creatinine (in micromole/L) Where X = 1.04 for females and X = 1.23 for malesarrow_forwardA researcher measured the rate of ADH excretion as a function of exercise. 6 Plasma 4 ADH Concentration (pG/mL) 2 50 100 150 200 250 Exercise (Watts) Perrault et. al. 1989 Based on the graph above, a student could infer that an increase in exercise effects ADH secretion and the resulting water levels in the blood, respectively, in the following way Select one: а. ADH Secretion Water Levels in Blood Increases Decreases b. ADH Secretion Water Levels in Blood Increases Increases с. ADH Secretion Water Levels in Blood Decreases Decreases d. ADH Secretion Water Levels in Blood Decreases Increasesarrow_forward
- Determine the cause-effect relationship of the following variables given. Choose the best answer that describes the possible changes in the variable (Y) because of the changes done to the variable (X). Activation of xanthine oxidase (x) vs. blood uric acid concentration (y) Group of answer choices Decrease Cannot be determined Increase No effectarrow_forwardDoes the lambda max increase as the concentration of the sample increase. True or False?arrow_forwardIf 1.1 grams of creatinine pass through the kidneys in a 24 hour period, what amount would you expect to find in the urine in the same time frame? 00 0.5 0.85 0 11arrow_forward
 Human Physiology: From Cells to Systems (MindTap ...BiologyISBN:9781285866932Author:Lauralee SherwoodPublisher:Cengage Learning