
Concept explainers
Videos
a.
Draw the plots of the proportion of bird eggs hatching for the lowlands and mid-elevation areas versus exposure time.
Identify whether the shapes of the plots are as expected in case of “logistic” plots.
a.
Answer to Problem 83E
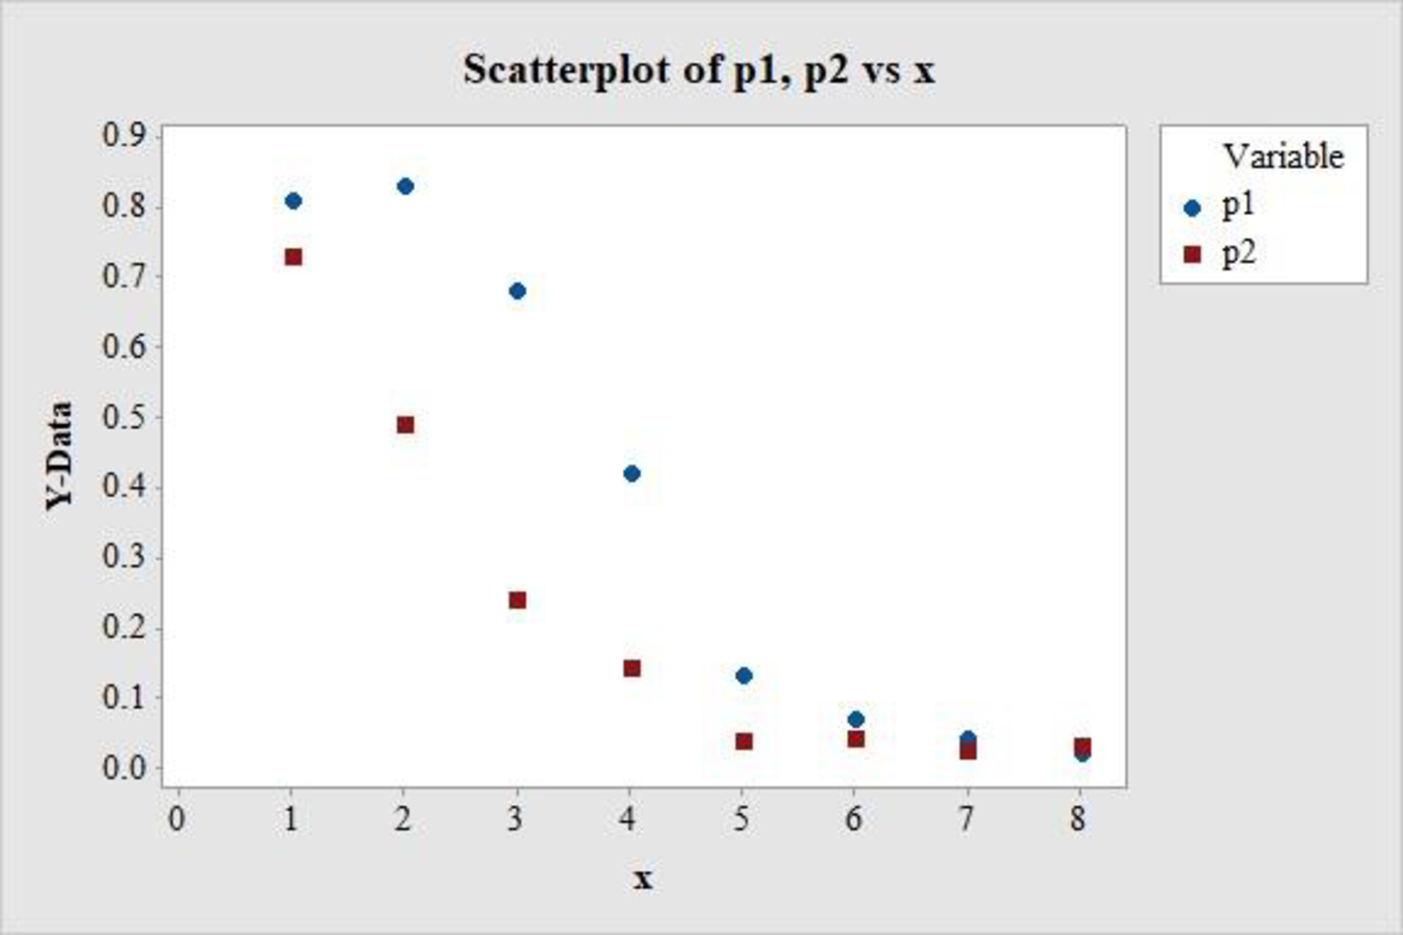
The plot of the proportion of bird eggs hatching for the lowlands and mid-elevation areas versus exposure time is as follows:
Explanation of Solution
Calculation:
The given data relates the proportion of bird eggs hatching for the lowlands, mid-elevation areas and cloud-forests with exposure time (days).
Denote the proportion of hatching for lowlands as
Software procedure:
Step-by-step procedure to draw the scatterplots using MINITAB software is given below:
- Choose Graph > Scatterplot.
- Choose Simple, and then click OK.
- Enter the column of p1 in the first cell under Y variables.
- Enter the column of x in the first cell under X variables.
- Enter the column of p2 in the second cell under Y variables.
- Enter the column of x in the second cell under X variables.
- Choose Multiple Graphs.
- Select Overlaid on the same graph under Show pairs of graph variables.
- Click OK in all dialogue boxes.
Thus, the scatterplot for the data is obtained.
The logistic plots usually have an approximate S-shaped distribution. In the above scatterplot, it is observed that both the proportions have approximately extended S-shaped distributions.
Hence, the shapes of the plots are more-or-less as expected in case of “logistic” plots.
b.
Find the value of
Fit a regression line of the form
Describe the significance of the negative slope.
b.
Answer to Problem 83E
The regression line fitted to the given data is
Explanation of Solution
Calculation:
Logistic regression:
The logistic regression equation for the prediction of a probability for the given value of the explanatory variable, x, is
The values of
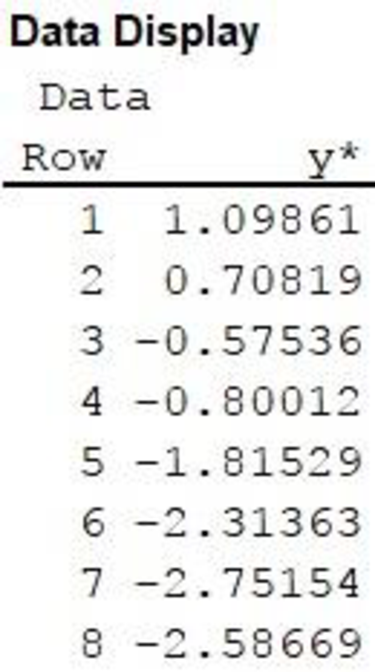
Data transformation
Software procedure:
Step-by-step procedure to transform the data using MINITAB software is given below:
- Choose Calc > Calculator.
- Enter the column of y* under Store result in variable.
- Enter the formula LN(‘p3’/(1–‘p3’)) under Expression.
- Click OK.
The transformed variable is stored in the column y*.
Data display:
Software procedure:
Step by step procedure to display the data using MINITAB software is given as,
- Choose Data > Display Data.
- Under Column, constants, and matrices to display, enter the column of y*.
- Click OK on all dialogue boxes.
The output using MINITAB software is given as follows:
Regression equation:
Software procedure:
Step by step procedure to obtain the regression equation using the MINITAB software:
- Choose Stat > Regression > Regression > Fit Regression Model.
- Enter the column of y* under Responses.
- Enter the columns of x under Continuous predictors.
- Choose Results and select Analysis of Variance, Model Summary, Coefficients, Regression Equation.
- Click OK in all dialogue boxes.
Output obtained using MINITAB is given below:
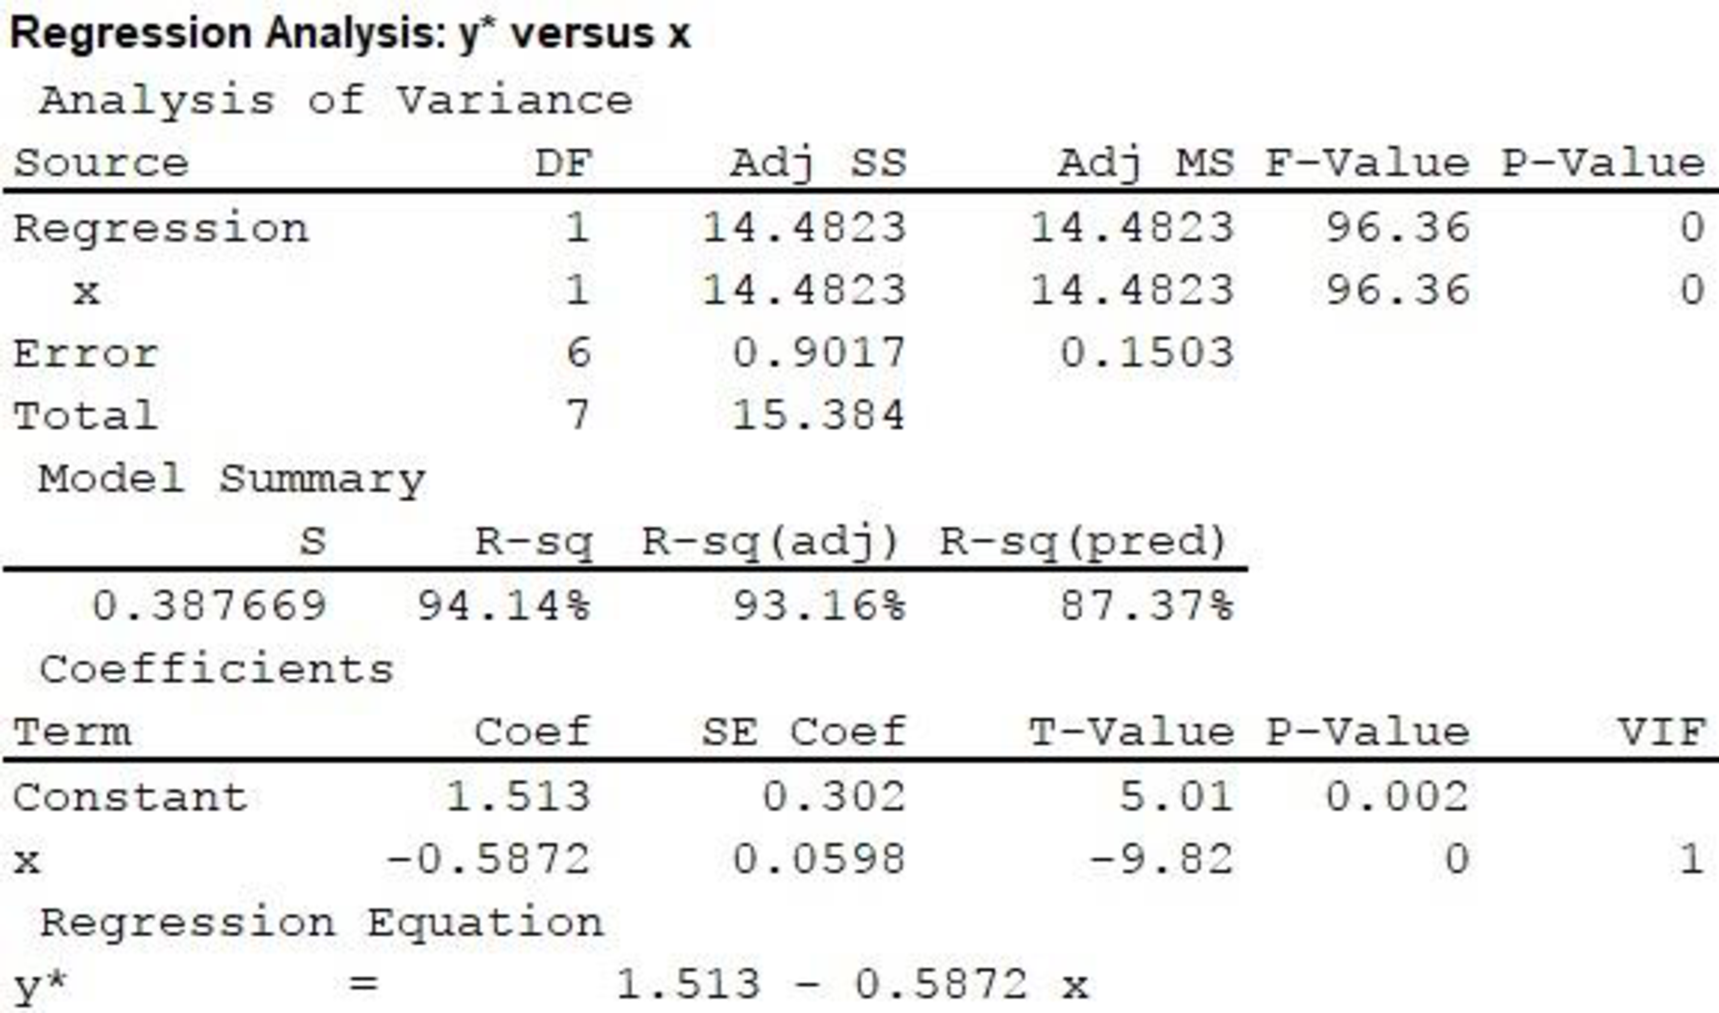
In the output, substituting
It is observed that the slope of x is –0.5872, which is negative. A negative slope implies that an increase in x causes a decrease in yꞌ.
Now, it is known that the quantity
In this case, an increase in exposure time decreases the natural logarithm of odds of hatching in the cloud forest area, which, in turn, implies a decrease in the odds of hatching.
Thus, the negative slope implies that an increase in exposure time causes a decrease in the odds of hatching of an egg in the cloud forest area.
c.
Predict the proportion of hatching in the cloud forest conditions, for an exposure time of 3 days.
Predict the proportion of hatching in the cloud forest conditions, for an exposure time of 5 days.
c.
Answer to Problem 83E
The proportion of hatching in the cloud forest conditions, for an exposure time of 3 days is 0.4382.
The proportion of hatching in the cloud forest conditions, for an exposure time of 5 days is 0.1942.
Explanation of Solution
Calculation:
For an exposure time of 3 days, substitute
Thus,
Thus, the proportion of hatching in the cloud forest conditions, for an exposure time of 3 days is 0.4382.
For an exposure time of 5 days, substitute
Thus,
Thus, the proportion of hatching in the cloud forest conditions, for an exposure time of 5 days is 0.1942.
d.
Identify the point of exposure time, at which, the proportion of hatching in the cloud forest conditions changes from greater than 0.5 to less than 0.5.
d.
Answer to Problem 83E
The exposure time, at which, the proportion of hatching in the cloud forest conditions changes from greater than 0.5 to less than 0.5 is 2.5766 days.
Explanation of Solution
Calculation:
For the proportion of hatching of 0.5, substitute
Thus,
As a result, the exposure time for the proportion of hatching of 0.5 is 2.5766 days.
Now, from the explanation in Part b, an increase in the exposure time causes a decrease in the odds of hatching in the cloud forest conditions. Thus, an increase in exposure time from 2.5766 days would cause a decrease in the proportion of hatching, whereas a decrease in exposure time from 2.5766 days would cause an increase in the proportion of hatching.
Thus, the exposure time, at which, the proportion of hatching in the cloud forest conditions changes from greater than 0.5 to less than 0.5 is 2.5766 days.
Want to see more full solutions like this?
Chapter 5 Solutions
Introduction To Statistics And Data Analysis


- Please conduct a step by step of these statistical tests on separate sheets of Microsoft Excel. If the calculations in Microsoft Excel are incorrect, the null and alternative hypotheses, as well as the conclusions drawn from them, will be meaningless and will not receive any points 3. Paired T-Test: A company implemented a training program to improve employee performance. To evaluate the effectiveness of the program, the company recorded the test scores of 25 employees before and after the training. Determine if the training program is effective in terms of scores of participants before and after the training. (Hints: The null can be about maintaining status-quo or no difference among groups; if alternative hypothesis is non-directional, use the two-tailed p-value from excel file to make a decision about rejecting or not rejecting the null) H0 = H1= Conclusion:arrow_forwardPlease conduct a step by step of these statistical tests on separate sheets of Microsoft Excel. If the calculations in Microsoft Excel are incorrect, the null and alternative hypotheses, as well as the conclusions drawn from them, will be meaningless and will not receive any points. The data for the following questions is provided in Microsoft Excel file on 4 separate sheets. Please conduct these statistical tests on separate sheets of Microsoft Excel. If the calculations in Microsoft Excel are incorrect, the null and alternative hypotheses, as well as the conclusions drawn from them, will be meaningless and will not receive any points. 1. One Sample T-Test: Determine whether the average satisfaction rating of customers for a product is significantly different from a hypothetical mean of 75. (Hints: The null can be about maintaining status-quo or no difference; If your alternative hypothesis is non-directional (e.g., μ≠75), you should use the two-tailed p-value from excel file to…arrow_forwardPlease conduct a step by step of these statistical tests on separate sheets of Microsoft Excel. If the calculations in Microsoft Excel are incorrect, the null and alternative hypotheses, as well as the conclusions drawn from them, will be meaningless and will not receive any points. 1. One Sample T-Test: Determine whether the average satisfaction rating of customers for a product is significantly different from a hypothetical mean of 75. (Hints: The null can be about maintaining status-quo or no difference; If your alternative hypothesis is non-directional (e.g., μ≠75), you should use the two-tailed p-value from excel file to make a decision about rejecting or not rejecting null. If alternative is directional (e.g., μ < 75), you should use the lower-tailed p-value. For alternative hypothesis μ > 75, you should use the upper-tailed p-value.) H0 = H1= Conclusion: The p value from one sample t-test is _______. Since the two-tailed p-value is _______ 2. Two-Sample T-Test:…arrow_forward
- Please conduct a step by step of these statistical tests on separate sheets of Microsoft Excel. If the calculations in Microsoft Excel are incorrect, the null and alternative hypotheses, as well as the conclusions drawn from them, will be meaningless and will not receive any points. What is one sample T-test? Give an example of business application of this test? What is Two-Sample T-Test. Give an example of business application of this test? .What is paired T-test. Give an example of business application of this test? What is one way ANOVA test. Give an example of business application of this test? 1. One Sample T-Test: Determine whether the average satisfaction rating of customers for a product is significantly different from a hypothetical mean of 75. (Hints: The null can be about maintaining status-quo or no difference; If your alternative hypothesis is non-directional (e.g., μ≠75), you should use the two-tailed p-value from excel file to make a decision about rejecting or not…arrow_forwardThe data for the following questions is provided in Microsoft Excel file on 4 separate sheets. Please conduct a step by step of these statistical tests on separate sheets of Microsoft Excel. If the calculations in Microsoft Excel are incorrect, the null and alternative hypotheses, as well as the conclusions drawn from them, will be meaningless and will not receive any points. What is one sample T-test? Give an example of business application of this test? What is Two-Sample T-Test. Give an example of business application of this test? .What is paired T-test. Give an example of business application of this test? What is one way ANOVA test. Give an example of business application of this test? 1. One Sample T-Test: Determine whether the average satisfaction rating of customers for a product is significantly different from a hypothetical mean of 75. (Hints: The null can be about maintaining status-quo or no difference; If your alternative hypothesis is non-directional (e.g., μ≠75), you…arrow_forwardWhat is one sample T-test? Give an example of business application of this test? What is Two-Sample T-Test. Give an example of business application of this test? .What is paired T-test. Give an example of business application of this test? What is one way ANOVA test. Give an example of business application of this test? 1. One Sample T-Test: Determine whether the average satisfaction rating of customers for a product is significantly different from a hypothetical mean of 75. (Hints: The null can be about maintaining status-quo or no difference; If your alternative hypothesis is non-directional (e.g., μ≠75), you should use the two-tailed p-value from excel file to make a decision about rejecting or not rejecting null. If alternative is directional (e.g., μ < 75), you should use the lower-tailed p-value. For alternative hypothesis μ > 75, you should use the upper-tailed p-value.) H0 = H1= Conclusion: The p value from one sample t-test is _______. Since the two-tailed p-value…arrow_forward
- 4. Dynamic regression (adapted from Q10.4 in Hyndman & Athanasopoulos) This exercise concerns aus_accommodation: the total quarterly takings from accommodation and the room occupancy level for hotels, motels, and guest houses in Australia, between January 1998 and June 2016. Total quarterly takings are in millions of Australian dollars. a. Perform inflation adjustment for Takings (using the CPI column), creating a new column in the tsibble called Adj Takings. b. For each state, fit a dynamic regression model of Adj Takings with seasonal dummy variables, a piecewise linear time trend with one knot at 2008 Q1, and ARIMA errors. c. What model was fitted for the state of Victoria? Does the time series exhibit constant seasonality? d. Check that the residuals of the model in c) look like white noise.arrow_forwardce- 216 Answer the following, using the figures and tables from the age versus bone loss data in 2010 Questions 2 and 12: a. For what ages is it reasonable to use the regression line to predict bone loss? b. Interpret the slope in the context of this wolf X problem. y min ball bas oft c. Using the data from the study, can you say that age causes bone loss? srls to sqota bri vo X 1931s aqsini-Y ST.0 0 Isups Iq nsalst ever tom vam noboslios tsb a ti segood insvla villemari aixs-Yediarrow_forward120 110 110 100 90 80 Total Score Scatterplot of Total Score vs. Putts grit bas 70- 20 25 30 35 40 45 50 Puttsarrow_forward
- 10 15 Answer the following, using the figures and tables from the temperature versus coffee sales data from Questions 1 and 11: a. How many coffees should the manager prepare to make if the temperature is 32°F? b. As the temperature drops, how much more coffee will consumers purchase?ov (Hint: Use the slope.) 21 bru sug c. For what temperature values does the voy marw regression line make the best predictions? al X al 1090391-Yrit,vewolf 30-X Inlog arts bauoxs 268 PART 4 Statistical Studies and the Hunt forarrow_forward18 Using the results from the rainfall versus corn production data in Question 14, answer DOV 15 the following: a. Find and interpret the slope in the con- text of this problem. 79 b. Find the Y-intercept in the context of this problem. alb to sig c. Can the Y-intercept be interpreted here? (.ob or grinisiques xs as 101 gniwollol edt 958 orb sz) asiques sich ed: flow wo PEMAIarrow_forwardVariable Total score (Y) Putts hit (X) Mean. 93.900 35.780 Standard Deviation 7.717 4.554 Correlation 0.896arrow_forward
 Algebra & Trigonometry with Analytic GeometryAlgebraISBN:9781133382119Author:SwokowskiPublisher:Cengage
 Functions and Change: A Modeling Approach to Coll...AlgebraISBN:9781337111348Author:Bruce Crauder, Benny Evans, Alan NoellPublisher:Cengage Learning
 Glencoe Algebra 1, Student Edition, 9780079039897...AlgebraISBN:9780079039897Author:CarterPublisher:McGraw Hill