Concept explainers
Videos
Consider the plot of the sinusoidal voltage
- Stretches the sinusoidal curve vertically.
Which statement best describes
b. Increasing the frequency f?
c. Decreasing
d. Decreasing the angular frequency w?
e. Increasing the period?
(a)
Change in sinusoidal voltage graph if peak amplitude is increased.
Answer to Problem 5.1P
Increasing the peak amplitude stretches the sinusoidal curve vertically.
Option (1).
Explanation of Solution
Given information:
Given sinusoidal voltage is
Calculation:
Graph of sinusoidal voltage is
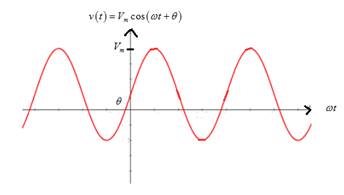
From the graph, it is noted thatif peak amplitude Vm is increased, it stretches the sinusoidal curve vertically.
(b)
Change in sinusoidal voltage graph if frequency is increased.
Answer to Problem 5.1P
Increasing the frequency compresses the sinusoidal curve horizontally.
Option (4).
Explanation of Solution
Given information:
Given sinusoidal voltage is
Calculation:
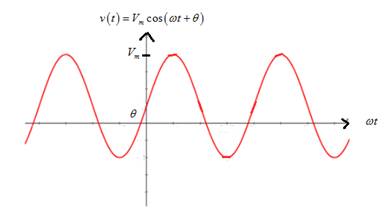
Graph of sinusoidal voltage is

From the graph, it is noted that if the frequency is increased,the time period is reduced so that it compresses the sinusoidal curve horizontally.
(c)
Change in sinusoidal voltage graph if phase angle (theta) is decreased.
Answer to Problem 5.1P
Decreasing the phase angle (theta) translates the sinusoidal curve to the right.
Option (5).
Explanation of Solution
Given information:
Given sinusoidal voltage is
Calculation:
Graph of sinusoidal voltage is

From the graph, it is noted that if the phase angle (theta) is decreased, it translates the sinusoidal curve to the right.
(d)
Change in sinusoidal voltage graph if the angular frequency is decreased.
Answer to Problem 5.1P
Decreasing the angular frequency stretches the sinusoidal voltage graph horizontally.
Option (3).
Explanation of Solution
Given information:
Given sinusoidal voltage is
Calculation:
Graph of sinusoidal voltage is
From the graph, it is noted that if the angular frequency is decreased, it increases the time period of the curve,which means it stretches sinusoidal horizontally.
(e)
Change in sinusoidal voltage graph if the time period is increased.
Answer to Problem 5.1P
Increasing the time period stretches the sinusoidal voltage graph horizontally.
Option (3).
Explanation of Solution
Given information:
Given sinusoidal voltage is
Calculation:
Graph of sinusoidal voltage is

From the graph, it is noted that if time period is increased, it stretches the sinusoidal voltage graph horizontally.
Want to see more full solutions like this?
Chapter 5 Solutions
Electrical Engineering: Principles & Applications (7th Edition)
Additional Engineering Textbook Solutions
Fundamentals of Applied Electromagnetics (7th Edition)
Introductory Circuit Analysis (13th Edition)
Java: An Introduction to Problem Solving and Programming (8th Edition)
Starting Out with Java: Early Objects (6th Edition)
Starting Out with Java: From Control Structures through Data Structures (3rd Edition)


- Relative to the reference sinusoid, what is the phase angle of i, vR and vL in degrees?arrow_forwardThe power factor angle of a purely inductive circuit is 0 degrees Select one: True Falsearrow_forwardAn industrial load consisting of a bank of induction motors consumes 50 kW at a power factor of 0.8 lagging from a 220-V,60-Hz, single-phase source. By placing a bank of capacitors in parallel with the load, the resultant power factor is to be raised to 0.95 lagging. Find the net capacitance of the capacitor bank in F that is required.arrow_forward
- Given the applied signal and network below: a.) Determine the sinusoidal expressions for ?1 and ?2 b.) Find the sinusoidal expression is by combining the two parallel capacitors.arrow_forwardWhat is the impedance of purely inductive circuit at a frequency value approaching to zero?arrow_forwardThe current in a pure capacitor circuit is i=0.17cos500t. If the rms value of the impressed emf is 80 volts. a) What are the equation for the voltage and power? b) What is the circuit frequency?arrow_forward
- 1. For the following sinusoids, determine which one leads and by how much a. ?(?) = 10cos (4? − 60°) and ?(?) = 6sin (4? + 50°)b. ?ଵ(?) = 4cos (377? + 10°) and ?ଶ(?) = −20cos(377?)c. ?(?) = 13 cos(2?) + 5 sin(2?) and ?(?) = 15cos (2? − 11.8°)arrow_forwardShown below is the voltage waveform applied to a pure capacitor of 100 uF. Solve for the RMS value and the average value of the voltage waveform. Choices for RMS value: A) 14.142 V B) 6.366 V C) 12.732 V D) 11.547 V Choices for average value: A) 5 V B) 20 V C) 10 V D) 12 Varrow_forwardb) Determine the voltage ?(?) and current ?(?) sinusoidal forms. Sketch one cycle of the waveforms in the same x-axis. Clearly indicating the peak value and the period of each waveform and the phase difference (in milliseconds) between the two waveforms. c) Determine the values of resistance R and inductance L. d) Determine the phasors ?L, ?r and ?c. e) Sketch the phasor diagram showing ?s, ?r, ?r, ?c and ?.arrow_forward
 Power System Analysis and Design (MindTap Course ...Electrical EngineeringISBN:9781305632134Author:J. Duncan Glover, Thomas Overbye, Mulukutla S. SarmaPublisher:Cengage Learning