
(a)
To show:
At interior optimum, the
Explanation of Solution
In
Budget constraint/line shows all probable combinations of two products that can be bought.
given the level of earning of the consumer and the market values of both products.
Indifference curve (IC) displays all probable combination of two goods that gives the same level of satisfaction to the consumer.
The consumption bundle is optimalat the point of tangency of the budget line and the indifference curve. The slope of the IC and the budget line are equal at this point.
Consumer's marginal utility functions
The Consumer has income I.
Let the prices of x and ybe denoted as Px and Py.
The interior optimum basket is specified by the solution:
Usingabove equation to find the demand for x as follows:
(b)
To calculate:
The value of Px for which consumer would ever purchase any X.
Answer to Problem 5.16P
Explanation of Solution
Utility function refers to measure preferences over set of product and services. it is majorly used in economics. A function is to satisfy consumers for all grouping of products consumed.
Marginal utility (MU) can be defined as the extra benefit added from the consumption of one more unit of a product or service.
The demand curve is the graph display the demand for products or service an alteration with a change in price.
Given
I =100, and
Since
The maximum value for which the consumer would buy can be calculated as −
From Equ (1), x = 0 (as it can't ne negative)
(c)
If
Explanation of Solution
Pattern of consumption is the expenses pattern of income groups in the categories of products like food, clothing and optional items.
The budget constraint traces the highest indifference curve accessible; the consumer is defined to be optimizing consumption.
Suppose that
Find out the optimal consumption basket of x and y.
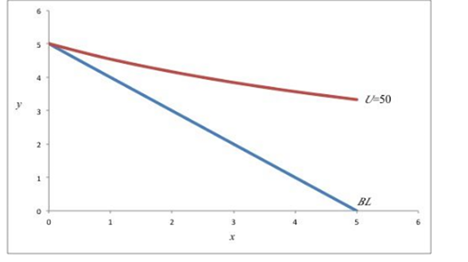
The utility function
This implies that the consumer could have a positive level of utility with purchases of y and no units of x.
The Utility is maximized in the graph
Since this corresponds to a corner point optimum where,
(d)
The marginal rate of substitution ofx for y with the ratio
Explanation of Solution
Marginal rate of substitution is used in economics. In this,the consumer gets some amount of one product in return for another product. It keeps the same level of utility.
The corner point has the price ratio
To compare this ratio to the marginal rate of substitution of x and y, use the equation for the marginal rate of substitution.
As the marginal rate of substitution of x for y is a smaller amount than the price ratio of 1 and the marginal rate of substitution of x for y is diminishing as xrises.
This confirms that the consumer would decrease utility if a positive amount of x were purchased.
(e)
If income remains at 100 then the demand schedule for x for all values Px is to be determinedand location dependsupon thevalue of Py is to be checked.
Explanation of Solution
Demand curve is the graph showing the demand for goods or service changes with change in price.
Let us draw the demand schedule for x for all values of Px when I =100 which is given by the equation is
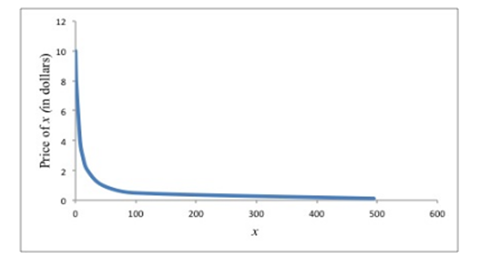
The demand curve for x is downward sloping and bowed towards the origin.
As the demand schedule equation
Want to see more full solutions like this?
Chapter 5 Solutions
EBK MICROECONOMICS


 Principles of Economics (12th Edition)EconomicsISBN:9780134078779Author:Karl E. Case, Ray C. Fair, Sharon E. OsterPublisher:PEARSON
 Engineering Economy (17th Edition)EconomicsISBN:9780134870069Author:William G. Sullivan, Elin M. Wicks, C. Patrick KoellingPublisher:PEARSON
 Principles of Economics (MindTap Course List)EconomicsISBN:9781305585126Author:N. Gregory MankiwPublisher:Cengage Learning
 Managerial Economics: A Problem Solving ApproachEconomicsISBN:9781337106665Author:Luke M. Froeb, Brian T. McCann, Michael R. Ward, Mike ShorPublisher:Cengage Learning
 Managerial Economics & Business Strategy (Mcgraw-...EconomicsISBN:9781259290619Author:Michael Baye, Jeff PrincePublisher:McGraw-Hill Education