
Concept explainers
Videos
a.
To find variables in the graph.
a.
Answer to Problem 47MR
Distance and time.
Explanation of Solution
From graph we can clearly see that the distance from home is varyingwith time. So, thevariables in the graph are distance and time.
b.
To find the relation between the variables at various point on the graph.
b.
Explanation of Solution
Given:
Graph showing a family’s distance fron home as they drive to the mountain.
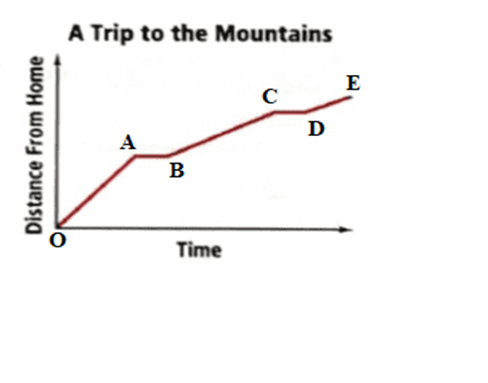
From the graph we can conclude that:
From OA graph show the linear variation between distance and time.
From AB graph show that distance is constant with time.
From BC graph show the linear variation between distance and time.
From CD graph show that distance is constant with time.
From DE graph show the linear variation between distance and time.
Chapter 4 Solutions
High School Math 2015 Common Core Algebra 1 Student Edition Grade 8/9
Additional Math Textbook Solutions
Intermediate Algebra
Linear Algebra and Its Applications (5th Edition)
College Algebra with Modeling & Visualization (6th Edition)
Algebra and Trigonometry
College Algebra (6th Edition)
Algebra and Trigonometry (6th Edition)


 Algebra and Trigonometry (6th Edition)AlgebraISBN:9780134463216Author:Robert F. BlitzerPublisher:PEARSON
 Contemporary Abstract AlgebraAlgebraISBN:9781305657960Author:Joseph GallianPublisher:Cengage Learning
 Linear Algebra: A Modern IntroductionAlgebraISBN:9781285463247Author:David PoolePublisher:Cengage Learning
 Algebra And Trigonometry (11th Edition)AlgebraISBN:9780135163078Author:Michael SullivanPublisher:PEARSON
 Introduction to Linear Algebra, Fifth EditionAlgebraISBN:9780980232776Author:Gilbert StrangPublisher:Wellesley-Cambridge Press
 College Algebra (Collegiate Math)AlgebraISBN:9780077836344Author:Julie Miller, Donna GerkenPublisher:McGraw-Hill Education