
Videos
To match: The graph with the appropriate table.
Explanation of Solution
Given:
The graph is:
The tables are:
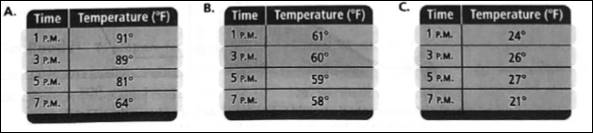
The graph is representing that the temperature is the highest initially and after that it is decreasing with the passage of time. The same pattern is being shown by the table (A). Thus, it could be said that the correct match for the provided graph is table (A).
Chapter 4 Solutions
High School Math 2015 Common Core Algebra 1 Student Edition Grade 8/9
Additional Math Textbook Solutions
College Algebra with Modeling & Visualization (6th Edition)
College Algebra in Context with Applications for the Managerial, Life, and Social Sciences (5th Edition)
Algebra and Trigonometry
A Graphical Approach to College Algebra (6th Edition)
Elementary and Intermediate Algebra: Concepts and Applications (7th Edition)
Elementary and Intermediate Algebra


 Algebra and Trigonometry (6th Edition)AlgebraISBN:9780134463216Author:Robert F. BlitzerPublisher:PEARSON
 Contemporary Abstract AlgebraAlgebraISBN:9781305657960Author:Joseph GallianPublisher:Cengage Learning
 Linear Algebra: A Modern IntroductionAlgebraISBN:9781285463247Author:David PoolePublisher:Cengage Learning
 Algebra And Trigonometry (11th Edition)AlgebraISBN:9780135163078Author:Michael SullivanPublisher:PEARSON
 Introduction to Linear Algebra, Fifth EditionAlgebraISBN:9780980232776Author:Gilbert StrangPublisher:Wellesley-Cambridge Press
 College Algebra (Collegiate Math)AlgebraISBN:9780077836344Author:Julie Miller, Donna GerkenPublisher:McGraw-Hill Education