
Concept explainers
Videos
Presidents and first ladies: The presents the ages of the last 10 U.S. presidents and their wives on the first day of their presidencies.
- Compute the least-squares regression line for predicting the president’s age from the first lady’s age.
- Compute the coefficient of determination-
- Construct a
scatterplot of the presidents' ages (y) versus the first ladies' ages (x). - Which point is an outlier?
- Remove die outlier and compute the least-squares regression line for predicting the president’s age from the first lady: s age.
- Is the outlier influential? Explain.
- Compute the coefficient of determination for the data set with the outlier removed. Is due proportion of variation explained by due least-squares regression he greater, less. or about the same without due outlier? Explain.
a.
To Calculate: The least-squares regression line for predicting the president’s age from lady’s age.
Answer to Problem 24E
The least-squares regression line is,
ˆy=14+0.8426x
Explanation of Solution
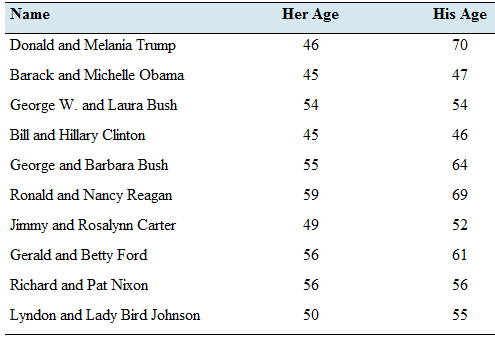
Given: The following table presents the age of the president’s and their wives on the first day of their presidencies.
| Name | Her Age | His Age |
| Donald and Melania Trump | 46 | 70 |
| Barak and Mechelle Obama | 45 | 47 |
| George W. and Laura Bush | 54 | 54 |
| Bill and Hillary Clinton | 45 | 46 |
| George and Babara Bush | 55 | 64 |
| Ronald and Nancy Reagan | 59 | 69 |
| Jimmy and Rosalyn Carter | 49 | 52 |
| Gerald and Betty Ford | 56 | 61 |
| Richard and Pat Nixon | 56 | 56 |
| Lyndon and Lady Bird Johnson | 50 | 55 |
Calculation:
Here,
y = president’s age
x = lady’s age
From below formula we can find least regression line.
ˆy=b0+b1x
where b0 and b1 are constants.
We can find these constants from below formulas.
b1=rsysxb0=ˉy−b1ˉxr=1n−1∑(x−ˉxsx)(y−ˉysy)
Where,
n is the number of observations
ˉx is the average of x
ˉy is the average of y
sx is the standard deviation of x
sy is the standard deviation of y
| Descriptive Statistics | |||
| N | Mean | Std. Deviation | |
| His age | 10 | 57.40 | 8.409 |
| Her age | 10 | 51.50 | 5.148 |
| Valid N (listwise) | 10 | ||
n=10 number of observations
ˉx=51.5 average of lady’s age (x)
ˉy=57.4 average of president’s age (y)
sx=5.148 standard deviation of x
sy=8.409 standard deviation of y
r=0.5159 correlation between x and y
To find constants,
b1=rsysxb1=0.5159×8.4095.148 =0.8426
And,
b0=ˉy−b1ˉx =57.4−(0.8426×51.5) b0=14.0061b0≈14
By substituting above formula,
y=b0+b1xy=14+0.8426x
Conclusion:
The least-squares regression line for predicting the president’s age from lady’s age is,
y=14+0.8426x
b.
To find: The correlation coefficient of the two variables.
Answer to Problem 24E
The correlation coefficient is found to be,
r=0.5159
Explanation of Solution
Calculation:
The correlation coefficient (r) is given by the formula,
r=1n−1∑(x−ˉxsx)(y−ˉysy)
Where sx and sy is the standard deviation of x and y .
The means and the standard deviations of the both variables can be obtained by using the Excel.
| Descriptive Statistics | |||
| N | Mean | Std. Deviation | |
| His age | 10 | 57.40 | 8.409 |
| Her age | 10 | 51.50 | 5.148 |
| Valid N (listwise) | 10 | ||
Then,
ˉx=51.5sx=5.148ˉy=57.4sy=8.409
Then, a table should be constructed to calculate r as follows.
Her AgexHis Ageyx−ˉxsxy−ˉysy(x−ˉxsx)(y−ˉysy)4670−1.06841.4984−1.60094547−1.2626−1.23681.561654540.4856−0.4043−0.19634546−1.2626−1.35571.711755640.67990.78490.533759691.45691.37952.00984952−0.4856−0.64220.311956610.87410.42810.374256560.8741−0.1665−0.14555055−0.2914−0.28540.0832∑(x−ˉxsx)(y−ˉysy)=4.6434
The correlation coefficient can be calculated as,
r=110−1×4.6434=4.64349r=0.5159
Conclusion:
The correlation coefficient between the interest rates for two mortgage plans is found tobe,
r=0.5159
c.
To graph: The scatter plot of the given two quantitative variables.
Explanation of Solution
Graph:
Let x be the lady’s age and y be the president’s age. The scatter plot can be constructed by the ordered pairs using the Excel.
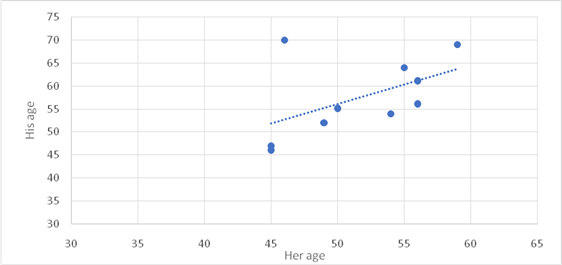
Interpretation:
Out of all these 10 ordered pairs, there is a weak positive relationship between president’s age and lady’s age.
d.
To Identify: The outliers within the given data.
Answer to Problem 24E
There is one outlier which is age 70
Explanation of Solution
Explain:
Here, Excel is used to calculate below statistics.
Q1 is the middle value in the first half of the rank-ordered data set.
Q2 is the median value in the set.
Q3 is the middle value in the second half of the rank-ordered data set.
The interquartile range is equal to Q3 minus Q1 .
To calculate upper bound,
Q3+(IQR×1.5)=Q3+((Q3−Q1)×1.5)=56.75+(56.75−48.5)×1.5=56.75+8.25×1.5=56.75+12.375Q3+(IQR×1.5)=69.125
To calculate lower bound,
Q1−(IQR×1.5)=Q1−((Q3−Q1)×1.5)=48.5−(56.75−48.5)×1.5=48.5−8.25×1.5=48.5−12.375Q1−(IQR×1.5)=36.125
An outlier is a data point that lies outside the upper bound and lower bound.
Q1Q3IQRLower BoundUpperBound48.556.758.2536.12569.125
Out of all 10 ordered pairs, only one value can be identified as an outlier, where the age is not between the lower bound and upper bound.
70>69.125
e.
To find: The least-squares regression line for predicting the president’s age from lady’s age with removing outlier.
Answer to Problem 24E
The least-squares regression is,
y=−14.7+1.3567x
Explanation of Solution
Calculation:
Here,
y = president’s age
x = lady’s age
From below formula we can find least regression line.
ˆy=b0+b1x
where b0 and b1 are constants.
We can find constants from below formulas.
b1=rsysxb0=ˉy−b1ˉxr=1n−1∑(x−ˉxsx)(y−ˉysy)
Where,
n is the number of observationsˉx is the average of x
ˉy is the average of y
sx is the standard deviation of x
sy is the standard deviation of y
When the outlier is removed, the number of ordered pairs is 9 .
| Descriptive Statistics | |||
| N | Mean | Std. Deviation | |
| His age | 9 | 56.00 | 7.583 |
| Her age | 9 | 52.11 | 5.061 |
| Valid N (listwise) | 9 | ||
n=9 ; number of observations.
ˉx=52.11 ; average of lady’s age (x)
ˉy=56 ; average of president’s age (y)
sx=5.061 ; standard deviation of x
sy=7.583 ; standard deviation of y
r=0.9055 ; correlation between x and y
To find constants,
b1=rsysxb1=(0.9055)7.5835.061 =1.3567
And,
b0=ˉy−b1ˉx =56−(1.3567)×52.11 =−14.6976 =−14.7
By substituting into the above formula,
y=b0+b1xy=−14.7+1.3567x
Conclusion:
The least-squares regression line for predicting the president’s age from lady’s age is,
y=−14.7+1.3567x
f.
To Check: The influence of outlier.
Answer to Problem 24E
Yes. It is influenced.
Explanation of Solution
Explain:
| Descriptive Statistics | |||
| N | Mean | Std. Deviation | |
| His age | 10 | 57.40 | 8.409 |
| Her age | 10 | 51.50 | 5.148 |
| Valid N (listwise) | 10 | ||
| Descriptive Statistics | |||
| N | Mean | Std. Deviation | |
| His age | 9 | 56.00 | 7.583 |
| Her age | 9 | 52.11 | 5.061 |
| Valid N (listwise) | 9 | ||
To calculate above statistics, Excel is used. Here we can see statistics with outlier and without outlier. Second table shows statistics without outlier. Total number of observations, mean and standard deviation of dependent and independent variables are changed. So, it influences to least squares regression line for predicting the president’s age from lady’s age.
g.
To find: The correlation coefficient of the two variables without outlier.
Answer to Problem 24E
The correlation coefficient is found to be,
r=0.9055
Explanation of Solution
Calculation:
The correlation coefficient (r) is given by the formula,
r=1n−1∑(x−ˉxsx)(y−ˉysy)
Where sx and sy is the standard deviation of x and y .
The means and the standard deviations of the both variables can be obtained by using the Excel.
For the remaining 9 pairs without the outlier,
| Descriptive Statistics | |||
| N | Mean | Std. Deviation | |
| His age | 9 | 56.00 | 7.583 |
| Her age | 9 | 52.11 | 5.061 |
| Valid N (listwise) | 9 | ||
Then,
ˉx=52.11sx=5.061ˉy=56sy=7.583
Then, a table should be constructed to calculate r as follows.
xyx−ˉxsxy−ˉysy(x−ˉxsx)(y−ˉysy)4547−1.4051−1.18691.667754540.3732−0.2637−0.09844546−1.4051−1.31871.852955640.57081.05500.602259691.36121.71442.33364952−0.6147−0.52750.324356610.76840.65940.506756560.7684005055−0.4171−0.13190.0550∑(x−ˉxsx)(y−ˉysy)=7.2438
The correlation coefficient can be calculated as,
r=19−1×7.2438=7.24388r=0.9055
Conclusion:
The correlation coefficient between the interest rates for two mortgage plans is found to be,
r=0.9055
Want to see more full solutions like this?
Chapter 4 Solutions
Elementary Statistics ( 3rd International Edition ) Isbn:9781260092561


- Question 5. We consider a put option with strike price K and expiration T. This option is priced using a 1-period CRR model. We consider r > 0, and σ > 0 very large. What is the approximate price of the option? In other words, what is the limit of the price of the option as σ∞. (Briefly justify your answer.)arrow_forwardQuestion 6. You collect daily data for the stock of a company Z over the past 4 months (i.e. 80 days) and calculate the log-returns (yk)/(-1. You want to build a CRR model for the evolution of the stock. The expected value and standard deviation of the log-returns are y = 0.06 and Sy 0.1. The money market interest rate is r = 0.04. Determine the risk-neutral probability of the model.arrow_forwardSeveral markets (Japan, Switzerland) introduced negative interest rates on their money market. In this problem, we will consider an annual interest rate r < 0. We consider a stock modeled by an N-period CRR model where each period is 1 year (At = 1) and the up and down factors are u and d. (a) We consider an American put option with strike price K and expiration T. Prove that if <0, the optimal strategy is to wait until expiration T to exercise.arrow_forward
- We consider an N-period CRR model where each period is 1 year (At = 1), the up factor is u = 0.1, the down factor is d = e−0.3 and r = 0. We remind you that in the CRR model, the stock price at time tn is modeled (under P) by Sta = So exp (μtn + σ√AtZn), where (Zn) is a simple symmetric random walk. (a) Find the parameters μ and σ for the CRR model described above. (b) Find P Ste So 55/50 € > 1). StN (c) Find lim P 804-N (d) Determine q. (You can use e- 1 x.) Ste (e) Find Q So (f) Find lim Q 004-N StN Soarrow_forwardIn this problem, we consider a 3-period stock market model with evolution given in Fig. 1 below. Each period corresponds to one year. The interest rate is r = 0%. 16 22 28 12 16 12 8 4 2 time Figure 1: Stock evolution for Problem 1. (a) A colleague notices that in the model above, a movement up-down leads to the same value as a movement down-up. He concludes that the model is a CRR model. Is your colleague correct? (Explain your answer.) (b) We consider a European put with strike price K = 10 and expiration T = 3 years. Find the price of this option at time 0. Provide the replicating portfolio for the first period. (c) In addition to the call above, we also consider a European call with strike price K = 10 and expiration T = 3 years. Which one has the highest price? (It is not necessary to provide the price of the call.) (d) We now assume a yearly interest rate r = 25%. We consider a Bermudan put option with strike price K = 10. It works like a standard put, but you can exercise it…arrow_forwardIn this problem, we consider a 2-period stock market model with evolution given in Fig. 1 below. Each period corresponds to one year (At = 1). The yearly interest rate is r = 1/3 = 33%. This model is a CRR model. 25 15 9 10 6 4 time Figure 1: Stock evolution for Problem 1. (a) Find the values of up and down factors u and d, and the risk-neutral probability q. (b) We consider a European put with strike price K the price of this option at time 0. == 16 and expiration T = 2 years. Find (c) Provide the number of shares of stock that the replicating portfolio contains at each pos- sible position. (d) You find this option available on the market for $2. What do you do? (Short answer.) (e) We consider an American put with strike price K = 16 and expiration T = 2 years. Find the price of this option at time 0 and describe the optimal exercising strategy. (f) We consider an American call with strike price K ○ = 16 and expiration T = 2 years. Find the price of this option at time 0 and describe…arrow_forward
- 2.2, 13.2-13.3) question: 5 point(s) possible ubmit test The accompanying table contains the data for the amounts (in oz) in cans of a certain soda. The cans are labeled to indicate that the contents are 20 oz of soda. Use the sign test and 0.05 significance level to test the claim that cans of this soda are filled so that the median amount is 20 oz. If the median is not 20 oz, are consumers being cheated? Click the icon to view the data. What are the null and alternative hypotheses? OA. Ho: Medi More Info H₁: Medi OC. Ho: Medi H₁: Medi Volume (in ounces) 20.3 20.1 20.4 Find the test stat 20.1 20.5 20.1 20.1 19.9 20.1 Test statistic = 20.2 20.3 20.3 20.1 20.4 20.5 Find the P-value 19.7 20.2 20.4 20.1 20.2 20.2 P-value= (R 19.9 20.1 20.5 20.4 20.1 20.4 Determine the p 20.1 20.3 20.4 20.2 20.3 20.4 Since the P-valu 19.9 20.2 19.9 Print Done 20 oz 20 oz 20 oz 20 oz ce that the consumers are being cheated.arrow_forwardT Teenage obesity (O), and weekly fast-food meals (F), among some selected Mississippi teenagers are: Name Obesity (lbs) # of Fast-foods per week Josh 185 10 Karl 172 8 Terry 168 9 Kamie Andy 204 154 12 6 (a) Compute the variance of Obesity, s²o, and the variance of fast-food meals, s², of this data. [Must show full work]. (b) Compute the Correlation Coefficient between O and F. [Must show full work]. (c) Find the Coefficient of Determination between O and F. [Must show full work]. (d) Obtain the Regression equation of this data. [Must show full work]. (e) Interpret your answers in (b), (c), and (d). (Full explanations required). Edit View Insert Format Tools Tablearrow_forwardThe average miles per gallon for a sample of 40 cars of model SX last year was 32.1, with a population standard deviation of 3.8. A sample of 40 cars from this year’s model SX has an average of 35.2 mpg, with a population standard deviation of 5.4. Find a 99 percent confidence interval for the difference in average mpg for this car brand (this year’s model minus last year’s).Find a 99 percent confidence interval for the difference in average mpg for last year’s model minus this year’s. What does the negative difference mean?arrow_forward
- A special interest group reports a tiny margin of error (plus or minus 0.04 percent) for its online survey based on 50,000 responses. Is the margin of error legitimate? (Assume that the group’s math is correct.)arrow_forwardSuppose that 73 percent of a sample of 1,000 U.S. college students drive a used car as opposed to a new car or no car at all. Find an 80 percent confidence interval for the percentage of all U.S. college students who drive a used car.What sample size would cut this margin of error in half?arrow_forwardYou want to compare the average number of tines on the antlers of male deer in two nearby metro parks. A sample of 30 deer from the first park shows an average of 5 tines with a population standard deviation of 3. A sample of 35 deer from the second park shows an average of 6 tines with a population standard deviation of 3.2. Find a 95 percent confidence interval for the difference in average number of tines for all male deer in the two metro parks (second park minus first park).Do the parks’ deer populations differ in average size of deer antlers?arrow_forward
 Glencoe Algebra 1, Student Edition, 9780079039897...AlgebraISBN:9780079039897Author:CarterPublisher:McGraw Hill
 Big Ideas Math A Bridge To Success Algebra 1: Stu...AlgebraISBN:9781680331141Author:HOUGHTON MIFFLIN HARCOURTPublisher:Houghton Mifflin Harcourt
 Holt Mcdougal Larson Pre-algebra: Student Edition...AlgebraISBN:9780547587776Author:HOLT MCDOUGALPublisher:HOLT MCDOUGAL
 Linear Algebra: A Modern IntroductionAlgebraISBN:9781285463247Author:David PoolePublisher:Cengage Learning
 Elementary Linear Algebra (MindTap Course List)AlgebraISBN:9781305658004Author:Ron LarsonPublisher:Cengage Learning