(a)
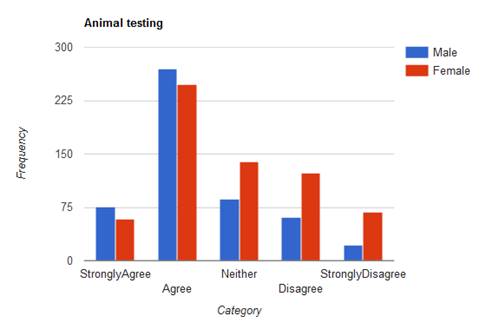
To construct segmented bar graphs to display the distribution of opinions for males and for females.
(a)
Explanation of Solution
The segmented bar graphs to display the distribution of opinions for males and for females is as follows:

The colour in red represents the female and the colour in blue represents the male in the graph above.
(b)
To find out is there an association between gender and opinion for the treatment of this sample or not and explain it.
(b)
Answer to Problem 119E
There is association between them.
Explanation of Solution
While looking at the data and the bar graph we note that the distribution of men and women are fairly similar. Also we do note that more men seem to (strongly) agree, while more women seem to (strongly) disagree. Thus, from this conclusion we can say that there is an association between gender and opinion for the treatment of this sample.
Chapter 4 Solutions
PRACTICE OF STATISTICS F/AP EXAM
Additional Math Textbook Solutions
Calculus: Early Transcendentals (2nd Edition)
A First Course in Probability (10th Edition)
University Calculus: Early Transcendentals (4th Edition)
College Algebra (7th Edition)
Elementary Statistics (13th Edition)
 MATLAB: An Introduction with ApplicationsStatisticsISBN:9781119256830Author:Amos GilatPublisher:John Wiley & Sons Inc
 Probability and Statistics for Engineering and th...StatisticsISBN:9781305251809Author:Jay L. DevorePublisher:Cengage Learning
 Statistics for The Behavioral Sciences (MindTap C...StatisticsISBN:9781305504912Author:Frederick J Gravetter, Larry B. WallnauPublisher:Cengage Learning
 Elementary Statistics: Picturing the World (7th E...StatisticsISBN:9780134683416Author:Ron Larson, Betsy FarberPublisher:PEARSON
 The Basic Practice of StatisticsStatisticsISBN:9781319042578Author:David S. Moore, William I. Notz, Michael A. FlignerPublisher:W. H. Freeman
 Introduction to the Practice of StatisticsStatisticsISBN:9781319013387Author:David S. Moore, George P. McCabe, Bruce A. CraigPublisher:W. H. Freeman


