
To draw: A labeled graph showing change in demand and the value of US dollar if imports from Europe are increased in US.
Explanation of Solution
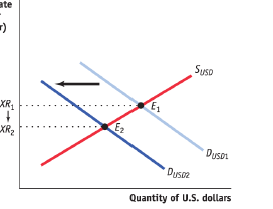
In the graph shown below, X1 and X2 represent the exchange rate (number of Euros per dollar), S represents supply and D represents demand. The demand for USD is reduced and the exchange rate is also reduced. This will reduce the value of USD.
Graph 1
If US imports from Europe are increasing then the demand for the US dollar will decrease which will depreciate the value of US currency or the foreign exchange rates. Thus, the US dollar is depreciated.
Foreign Exchange rate: The rate at which currencies of two different countries are exchanged. In other words, it is the rate at which one currency is exchanged with the other currency.
Chapter 42 Solutions
Krugman's Economics For The Ap® Course


 Principles of Economics (12th Edition)EconomicsISBN:9780134078779Author:Karl E. Case, Ray C. Fair, Sharon E. OsterPublisher:PEARSON
 Engineering Economy (17th Edition)EconomicsISBN:9780134870069Author:William G. Sullivan, Elin M. Wicks, C. Patrick KoellingPublisher:PEARSON
 Principles of Economics (MindTap Course List)EconomicsISBN:9781305585126Author:N. Gregory MankiwPublisher:Cengage Learning
 Managerial Economics: A Problem Solving ApproachEconomicsISBN:9781337106665Author:Luke M. Froeb, Brian T. McCann, Michael R. Ward, Mike ShorPublisher:Cengage Learning
 Managerial Economics & Business Strategy (Mcgraw-...EconomicsISBN:9781259290619Author:Michael Baye, Jeff PrincePublisher:McGraw-Hill Education