
To draw: A labeled graph showing equilibrium and the change in equilibrium if the exchange rate (Yen per dollar) is reduced affected the demand for the US dollar by Japanese investors.
Explanation of Solution
In the graph shown below, XR1 and XR2 represent the exchange rate, the S curve shows the supply for the US dollar, D1 and D2 represent the demand curve for USD, and E1 and E2 represent the equilibrium.
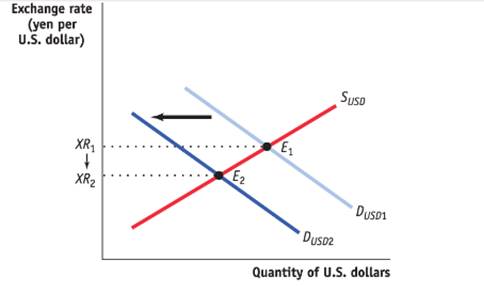
Equilibrium is shifted towards the left if XR1 moves to XR2. D1 also moved to D2 resulting in a new equilibrium i.e. E2.
If the exchange rate is reduced then the US dollar is depreciated. For instance, initially, 10 Japanese yen was required against 1 dollar whereas after a reduction in exchange rate only 5 Yen is required against the dollar.
Thus, the US dollar is depreciated.
Foreign Exchange rate: The rate at which currencies of two different countries are exchanged. In other words, it is the rate at which one currency is exchanged with the other currency.
Chapter 42 Solutions
Krugman's Economics For The Ap® Course


 Principles of Economics (12th Edition)EconomicsISBN:9780134078779Author:Karl E. Case, Ray C. Fair, Sharon E. OsterPublisher:PEARSON
 Engineering Economy (17th Edition)EconomicsISBN:9780134870069Author:William G. Sullivan, Elin M. Wicks, C. Patrick KoellingPublisher:PEARSON
 Principles of Economics (MindTap Course List)EconomicsISBN:9781305585126Author:N. Gregory MankiwPublisher:Cengage Learning
 Managerial Economics: A Problem Solving ApproachEconomicsISBN:9781337106665Author:Luke M. Froeb, Brian T. McCann, Michael R. Ward, Mike ShorPublisher:Cengage Learning
 Managerial Economics & Business Strategy (Mcgraw-...EconomicsISBN:9781259290619Author:Michael Baye, Jeff PrincePublisher:McGraw-Hill Education