
Concept explainers
Videos
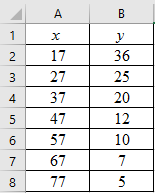
Auto Accidents: Age Data for this problem are based on information taken from The Wall Street Journal. Let x be the age in years of a licensed automobile driver. Let y be the percentage of all fatal accidents (for a given age) due to speeding. For example, the first data pair indicates that 36% of all fatal accidents involving 17-year-olds are due to speeding.
| x | 17 | 27 | 37 | 47 | 57 | 67 | 77 |
| y | 36 | 25 | 20 | 12 | 10 | 7 | 5 |
Complete parts (a) through (e), given
(f) Predict the percentage of all fatal accidents due to speeding for 25-year-olds.
(a)
To graph: The scatter diagram for age in years of a licensed automobile driver (x) and percentage of all fatal accidents (y).
Explanation of Solution
Given: The data which consists of variables, ‘age of a licensed automobile driver (in years)’ and ‘the percentage of all fatal accidents (for a given age)’ due to speeding, represented by x and y respectively, is provided.
Graph:
Follow the steps given below in Excel to obtain the scatter diagram of the data.
Step 1: Enter the data into Excel sheet. The screenshot is given below.
Step 2: Select the data and click on ‘Insert’. Go to charts and select the chart type ‘Scatter’.

Step 3: Select the first plot and then click ‘add chart element’ provided in the left corner of the menu bar. Insert the ‘Axis titles’ and ‘Chart title’. The scatter plot for the provided data is shown below:
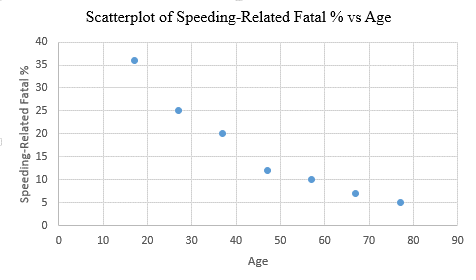
Interpretation: The scatterplot shows that, there is a negative correlation between the age of a licensed automobile drivers and the speeding- related fatal percentage. So, as the age increases, the fatal percentage related to speeding decreases and vice versa.
(b)
To test: Whether the provided values of
Answer to Problem 11P
Solution: The provided values, that is,
Explanation of Solution
Given: The provided values are:
Calculation:
To compute
| 17 | 36 | 289 | 1296 | 612 |
| 27 | 25 | 729 | 625 | 675 |
| 37 | 20 | 1369 | 400 | 740 |
| 47 | 12 | 2209 | 144 | 564 |
| 57 | 10 | 3249 | 100 | 570 |
| 67 | 7 | 4489 | 49 | 469 |
| 77 | 5 | 5929 | 25 | 385 |
Now, the value of
Substituting the values in the above formula. Thus:
Thus, the value of
Conclusion: The provided values,
(c)
To find: The values of
Answer to Problem 11P
Solution: The calculated values are,
Explanation of Solution
Given: The provided values are,
Calculation:
The value of
The value of
The value of
The value of
Therefore, the values are,
The general formula for the least-squares line is,
Here, a is the y-intercept and b is the slope.
Substitute the values of a and b in the general equation, to get the least-squares line of the data. That is,
Therefore, the least-squares line is
(d)
To graph: The least-squares line on the scatter diagram which passes through the point
Explanation of Solution
Given: The data which consists of variables, ‘age of a licensed automobile driver (in years)’ and ‘the fatal accidents percentage (for a given age) due to speeding’, represented by x and y respectively, is provided.
Graph:
Follow the steps given below in Excel to obtain the scatter diagram of the data.
Step 1: Enter the data into Excel sheet. The screenshot is given below.
Step 2: Select the data and click on ‘Insert’. Go to charts and select the chart type ‘Scatter’.
Step 3: Select the first plot and then click ‘add chart element’ provided in the left corner of the menu bar. Insert the ‘Axis titles’ and ‘Chart title’. The scatter plot for the provided data is shown below:
Step 3: Right click on any data point and select ‘Add Trendline’. In the dialogue box, select ‘linear’ and check ‘Display Equation on Chart’
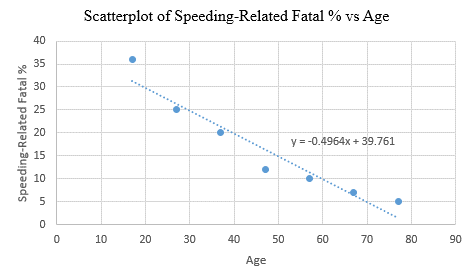
Interpretation: The least-squares line passes through the point
(e)
The value of
Answer to Problem 11P
Solution: The value of
Explanation of Solution
Given: The value of the correlation coefficient (r) is
Calculation: The coefficient of determination
Therefore, the value of
The value of
Further, the proportion of variation in y that is unexplained can be calculated as:
Hence, the percentage of variation in y that is unexplained is 8%.
Interpretation: About 92% of the variation in y (fatal % due to speeding) can be explained by the corresponding variation in x (age) and the least-squares line. The rest 8% of variation remains unexplained.
(f)
To find: The predicted percentage of speeding related fatal accidents
Answer to Problem 11P
Solution: The predicted value is approximately 27.36%.
Explanation of Solution
Given: The least-squares line from part (c) is,
Calculation:
The predicted value
Thus, the value of
Interpretation: The percentage of all fatal accidents due to speeding for 25-years-olds is predicted to be 27.36%.
Want to see more full solutions like this?
Chapter 4 Solutions
Understanding Basic Statistics


- An electronics company manufactures batches of n circuit boards. Before a batch is approved for shipment, m boards are randomly selected from the batch and tested. The batch is rejected if more than d boards in the sample are found to be faulty. a) A batch actually contains six faulty circuit boards. Find the probability that the batch is rejected when n = 20, m = 5, and d = 1. b) A batch actually contains nine faulty circuit boards. Find the probability that the batch is rejected when n = 30, m = 10, and d = 1.arrow_forwardTwenty-eight applicants interested in working for the Food Stamp program took an examination designed to measure their aptitude for social work. A stem-and-leaf plot of the 28 scores appears below, where the first column is the count per branch, the second column is the stem value, and the remaining digits are the leaves. a) List all the values. Count 1 Stems Leaves 4 6 1 4 6 567 9 3688 026799 9 8 145667788 7 9 1234788 b) Calculate the first quartile (Q1) and the third Quartile (Q3). c) Calculate the interquartile range. d) Construct a boxplot for this data.arrow_forwardPam, Rob and Sam get a cake that is one-third chocolate, one-third vanilla, and one-third strawberry as shown below. They wish to fairly divide the cake using the lone chooser method. Pam likes strawberry twice as much as chocolate or vanilla. Rob only likes chocolate. Sam, the chooser, likes vanilla and strawberry twice as much as chocolate. In the first division, Pam cuts the strawberry piece off and lets Rob choose his favorite piece. Based on that, Rob chooses the chocolate and vanilla parts. Note: All cuts made to the cake shown below are vertical.Which is a second division that Rob would make of his share of the cake?arrow_forward
- Three players (one divider and two choosers) are going to divide a cake fairly using the lone divider method. The divider cuts the cake into three slices (s1, s2, and s3). If the choosers' declarations are Chooser 1: {s1 , s2} and Chooser 2: {s2 , s3}. Using the lone-divider method, how many different fair divisions of this cake are possible?arrow_forwardTheorem 2.6 (The Minkowski inequality) Let p≥1. Suppose that X and Y are random variables, such that E|X|P <∞ and E|Y P <00. Then X+YpX+Yparrow_forwardTheorem 1.2 (1) Suppose that P(|X|≤b) = 1 for some b > 0, that EX = 0, and set Var X = 0². Then, for 0 0, P(X > x) ≤e-x+1²² P(|X|>x) ≤2e-1x+1²² (ii) Let X1, X2...., Xn be independent random variables with mean 0, suppose that P(X ≤b) = 1 for all k, and set oσ = Var X. Then, for x > 0. and 0x) ≤2 exp Σ k=1 (iii) If, in addition, X1, X2, X, are identically distributed, then P(S|x) ≤2 expl-tx+nt²o).arrow_forward
- Theorem 5.1 (Jensen's inequality) state without proof the Jensen's Ineg. Let X be a random variable, g a convex function, and suppose that X and g(X) are integrable. Then g(EX) < Eg(X).arrow_forwardCan social media mistakes hurt your chances of finding a job? According to a survey of 1,000 hiring managers across many different industries, 76% claim that they use social media sites to research prospective candidates for any job. Calculate the probabilities of the following events. (Round your answers to three decimal places.) answer parts a-c. a) Out of 30 job listings, at least 19 will conduct social media screening. b) Out of 30 job listings, fewer than 17 will conduct social media screening. c) Out of 30 job listings, exactly between 19 and 22 (including 19 and 22) will conduct social media screening. show all steps for probabilities please. answer parts a-c.arrow_forwardQuestion: we know that for rt. (x+ys s ا. 13. rs. and my so using this, show that it vye and EIXI, EIYO This : E (IX + Y) ≤2" (EIX (" + Ely!")arrow_forward
- Theorem 2.4 (The Hölder inequality) Let p+q=1. If E|X|P < ∞ and E|Y| < ∞, then . |EXY ≤ E|XY|||X|| ||||qarrow_forwardTheorem 7.6 (Etemadi's inequality) Let X1, X2, X, be independent random variables. Then, for all x > 0, P(max |S|>3x) ≤3 max P(S| > x). Isk≤narrow_forwardTheorem 7.2 Suppose that E X = 0 for all k, that Var X = 0} x) ≤ 2P(S>x 1≤k≤n S√2), -S√2). P(max Sk>x) ≤ 2P(|S|>x- 1arrow_forwardarrow_back_iosSEE MORE QUESTIONSarrow_forward_ios
 Glencoe Algebra 1, Student Edition, 9780079039897...AlgebraISBN:9780079039897Author:CarterPublisher:McGraw Hill
 Functions and Change: A Modeling Approach to Coll...AlgebraISBN:9781337111348Author:Bruce Crauder, Benny Evans, Alan NoellPublisher:Cengage Learning
 Big Ideas Math A Bridge To Success Algebra 1: Stu...AlgebraISBN:9781680331141Author:HOUGHTON MIFFLIN HARCOURTPublisher:Houghton Mifflin Harcourt
 Holt Mcdougal Larson Pre-algebra: Student Edition...AlgebraISBN:9780547587776Author:HOLT MCDOUGALPublisher:HOLT MCDOUGAL
 Linear Algebra: A Modern IntroductionAlgebraISBN:9781285463247Author:David PoolePublisher:Cengage Learning