
Concept explainers
Videos
Education of Fathers and Mothers The data shown in the table are the numbers of years of formal education of the fathers and mothers of a sample of 29 statistics students at a small com-munity college in an area with many recent immigrants. (The means are both about 8, and the standard deviations are both about 4.6.) The
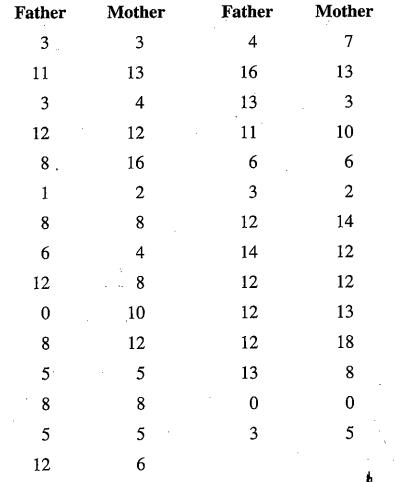
a. Find and report the regression equation for predicting the Mother's years of education from the father's. Then find the predicted number of years for the mother if the father has 12 years of education, and find the predicted number of years for a mother if the father has 4 years of education.
b. Find and report the regression equation for predicting the father years of education from the mother. Then find the predicted number of years for the father if the mother has 12 years of education, and find the predicted number of years for the father if the mother has 4 years od education.
c. What phenomenon from the chapter does this demonstrate? Explain.
Want to see the full answer?
Check out a sample textbook solution
Chapter 4 Solutions
Introductory Statistics (2nd Edition)


- Life Expectancy The following table shows the average life expectancy, in years, of a child born in the given year42 Life expectancy 2005 77.6 2007 78.1 2009 78.5 2011 78.7 2013 78.8 a. Find the equation of the regression line, and explain the meaning of its slope. b. Plot the data points and the regression line. c. Explain in practical terms the meaning of the slope of the regression line. d. Based on the trend of the regression line, what do you predict as the life expectancy of a child born in 2019? e. Based on the trend of the regression line, what do you predict as the life expectancy of a child born in 1580?2300arrow_forwardEXERCISES The following table gives the life expectancy at birth of females born in the United States in various years from 1970 to 2010. Source: National Center for Health Statistics. Year of Birth Life Expectancy years 1970 74.7 1975 76.6 1980 77.4 1985 78.2 1990 78.8 1995 78.9 2000 79.3 2005 79.9 2010 81.0 Find the life expectancy predicted by your regression equation for each year in the table, and subtract it from the actual value in the second column. This gives you a table of residuals. Plot your residuals as points on a graph.arrow_forward
 Functions and Change: A Modeling Approach to Coll...AlgebraISBN:9781337111348Author:Bruce Crauder, Benny Evans, Alan NoellPublisher:Cengage Learning
 Calculus For The Life SciencesCalculusISBN:9780321964038Author:GREENWELL, Raymond N., RITCHEY, Nathan P., Lial, Margaret L.Publisher:Pearson Addison Wesley,
 Glencoe Algebra 1, Student Edition, 9780079039897...AlgebraISBN:9780079039897Author:CarterPublisher:McGraw Hill
 Big Ideas Math A Bridge To Success Algebra 1: Stu...AlgebraISBN:9781680331141Author:HOUGHTON MIFFLIN HARCOURTPublisher:Houghton Mifflin Harcourt