
Concept explainers
Videos
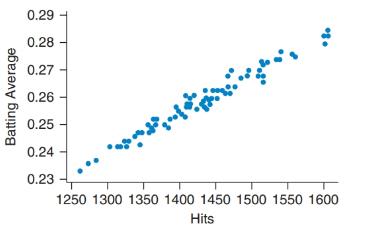
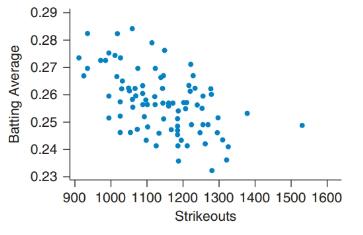
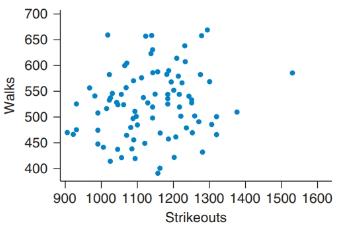
Matching Match each of the following
(A)
(B)
(C)
Want to see the full answer?
Check out a sample textbook solution
Chapter 4 Solutions
Introductory Statistics (2nd Edition)
Additional Math Textbook Solutions
APPLIED STAT.IN BUS.+ECONOMICS
The Practice of Statistics for AP - 4th Edition
Statistics Through Applications
Basic Business Statistics, Student Value Edition (13th Edition)
Elementary Statistics: A Step By Step Approach


- Running Speed A man is running around a circular track that is 200 m in circumference. An observer uses a stopwatch to record the runner’s time at the each of each lap, obtaining the data in the following table. (a) What was the man’s average speed (rate) between 68 s and 152 s? (b) What was the man’s average speed between 263 s and 412 s? (c) Calculate the man’s speed for cadi lap, Is he slowing down, speeding up, or neither?arrow_forwardRunning Speed A man is running around a circular track that is 200 m in circumference. An observer uses a stopwatch to record the runners time at the end of each lap, obtaining the data in the following table. aWhat was the mans average speed rate between 68 s and 152 s? bWhat was the mans average speed between 263 s and 412 s? cCalculate the mans speed for each lap. Is he slowing down, speeding up or neither? Time s Distance m 32 200 68 400 108 600 152 800 203 1000 263 1200 335 1400 412 1600arrow_forwardThree Was TieA downhill skiing race ends in a three-way tie for first place. The graph shows distance as a function of time for each of the three winners, A, B, and C. Find the average speed for each skier Describe the differences between the ways in which the three participants skied the race.arrow_forward
- The US. import of wine (in hectoliters) for several years is given in Table 5. Determine whether the trend appearslinear. Ifso, and assuming the trend continues, in what year will imports exceed 12,000 hectoliters?arrow_forwardThe U.S. Census tracks the percentage of persons 25 years or older who are college graduates. That data forseveral years is given in Table 4[14]. Determine whether the trend appears linear. If so, and assuming the trendcontinues. in what year will the percentage exceed 35%?arrow_forward
 Big Ideas Math A Bridge To Success Algebra 1: Stu...AlgebraISBN:9781680331141Author:HOUGHTON MIFFLIN HARCOURTPublisher:Houghton Mifflin Harcourt
 Glencoe Algebra 1, Student Edition, 9780079039897...AlgebraISBN:9780079039897Author:CarterPublisher:McGraw Hill
 Algebra & Trigonometry with Analytic GeometryAlgebraISBN:9781133382119Author:SwokowskiPublisher:Cengage
 College AlgebraAlgebraISBN:9781305115545Author:James Stewart, Lothar Redlin, Saleem WatsonPublisher:Cengage Learning
 Algebra and Trigonometry (MindTap Course List)AlgebraISBN:9781305071742Author:James Stewart, Lothar Redlin, Saleem WatsonPublisher:Cengage Learning