
Foundations Of Finance
10th Edition
ISBN: 9780134897264
Author: KEOWN, Arthur J., Martin, John D., PETTY, J. William
Publisher: Pearson,
expand_more
expand_more
format_list_bulleted
Concept explainers
Videos
Textbook Question
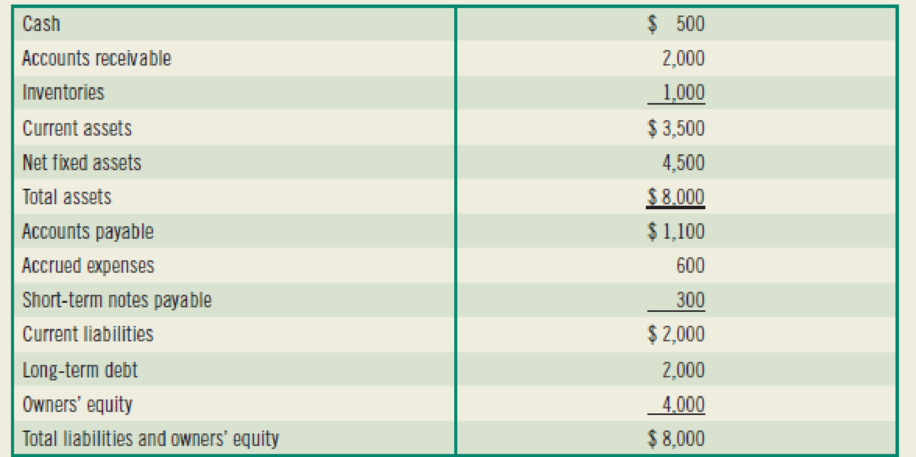
Chapter 4, Problem 6SP
(Ratio analysis) The
Balance Sheet ($000)
Income Statement ($000)
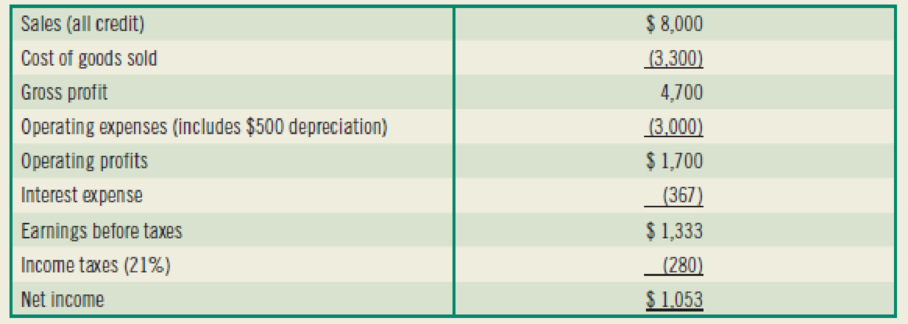
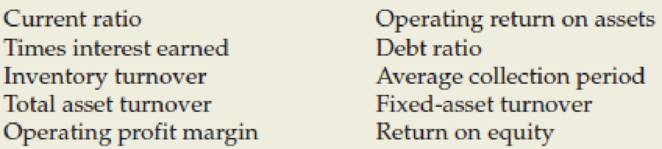
Calculate the following ratios:
Expert Solution & Answer
Want to see the full answer?
Check out a sample textbook solution
Students have asked these similar questions
Use the selected balance sheet and income statement information below for Anka Inc. to compute the current ratio. Explain what information this ratio provides.
Current Assets $26,300,450
Current Liabilities $14,879,200
Pretax Income $4,300,600
Interest Expense $1,300,000
Alex is currently considering to invest his money in one of the companies betweenCompany A and Company B. The summarized final accounts of the companies for theirlast completed financial year are as follows: (refer to the images)
Required:a. Calculate the following ratios for Company A and Company B. State clearly theformulae used for each ratio:i. Gross Profit Marginii. Net Profit Marginiii. Inventory Turnover Period (days)iv. Receivables Collection Period (days)v. Payables Payment Period (days)vi. Current Ratiovii. Quick Ratiob. Comment on each of the ratios calculated in part (a) above.
VII. Direction: Compute and interpret.
The following comparative financial statements are provided by Avatar Industries. You were asked
to compute the different financial ratios and provide your interpretations with regards to
profitability, efficiency, liquidity and solvency of the company. Use the Answer Sheet template
below to input your answer and solution.
AVATAR INDUSTRIES
AVATAR INDUSTRIES
Comparative Statement of Financial Position
For the years 2019 and 2018
Comparative Income Statement
For the years 2019 and 2018
2019
2018
2019
2018
ASSETS
Current Assets:
Sales
P200,000
P210,000
Cash & Cash Equivalent
P65,000
P70,000
Sales Returns and Allowances
40,000
25,000
Accounts Receivable
40,000
35,000
Net Sales
160,000
185,000
Marketable Secuities
40,000
35,000
Cost of Goods Sold
100,000
115,625
Inventory
100,000
80,000
Gross Profit
60,000
69,375
Total Current Assets
220,000
200,000 160,000
P445,000 P380,000
245,000
Operating Expenses:
Fixed Assets
Selling Expenses
22,000
25,000
Total…
Chapter 4 Solutions
Foundations Of Finance
Ch. 4 - Describe the five-question approach to using...Ch. 4 - What are the limitations of industry average...Ch. 4 - What is the difference between a firms gross...Ch. 4 - Prob. 9RQCh. 4 - Prob. 1SPCh. 4 - Prob. 2SPCh. 4 - Prob. 3SPCh. 4 - (Price/ book) Chang, Inc.s balance sheet shows a...Ch. 4 - Prob. 5SPCh. 4 - (Ratio analysis) The balance sheet and income...
Knowledge Booster


Learn more about
Need a deep-dive on the concept behind this application? Look no further. Learn more about this topic, finance and related others by exploring similar questions and additional content below.Similar questions
- VII. Direction: Compute and interpret. The following comparative financial statements are provided by Avatar Industries. You were asked to compute the different financial ratios and provide your interpretations with regards to profitability, efficiency, liquidity and solvency of the company. Use the Answer Sheet template below to input your answer and solution. AVATAR INDUSTRIES AVATAR INDUSTRIES Comparative Statement of Financial Position For the years 2019 and 2018 Comparative Income Statement For the years 2019 and 2018 2019 2018 2019 2018 ASSETS Current Assets: Sales P200,000 P210,000 Cash & Cash Equivalent P65,000 P70,000 Sales Returns and Allowances 40,000 25,000 Accounts Receivable 40,000 35,000 Net Sales 160,000 185,000 Marketable Securities 40,000 35,000 Cost of Goods Sold 100,000 115,625 Inventory 100,000 80,000 Gross Profit 60,000 69,375 Total Current Assets 245,000 220,000 Operating Expenses: Fixed Assets 200,000 160,000 Selling Expenses 22,000 25,000 Total Assets P445,000…arrow_forwardComplete the balance sheet and sales information below for Iceberg Industries using the following financial data:arrow_forwardb. Comment on each of the ratios calculated in part (a). ABOVE IS THE QUESTION THAT I NEED ANSWER, BELOW IS THE QUESTION (A) ANSWER THAT MENTIONED IN QUESTION (B) a) Calculate the following ratios for Company A and Company B. State clearly the formulae used for each ratio: ANSWER i) Gross Profit Margin Formula: Gross profit Margin = ( Gross profit / Net sales ) x 100 Company A : = ( 40000 / 160000 ) x 100 = 25 % Company B : = ( 60000 / 240000 ) x 100 = 25 % ii)Net Profit Margin Net profit Margin = ( Net profit / Net sales ) x 100 Company A : = ( 9000 / 160000 ) x 100 = 5.625 % Company B: = ( 18000 / 240000 ) x 100 = 7.5 % iii) Inventory Turnover Period (days) Inventory Turnover Period (days) = ( Inventory / Cost of sales ) x 365 Company A: = ( 30000 / 120000 ) x 100 = 25 % Company B: = ( 50000 / 180000 ) x 100 = 27.777 % iv) Receivables Collection Period (days) Receivables Collection Period (days) = ( Receivables / Net sales ) x 365…arrow_forward
- Below are three ratios introduced in your text. Describe the purpose for each of them, and also state the formula for calculating them: a. Revenue Per Employee Ratio: b. Quick Ratio: c. Fixed Assets Ratio:arrow_forwardBelow are the two basic financial statements of Chiz Trading Company. You are tasked to prepare an analysis using Horizontal and Vertical Analysis of their two-dated financial statements. In addition to this you have been tasked to prepare financial ratios measuring the company’s: Liquidity Status Current Ratios Quick Asset Ratios Efficiency Status Asset Turnover Fixed Asset Turnover Inventory Turnover Days in Inventory Accounts Receivable Turnover Days in Receivable Profitability Status: Gross Profit margin Ratio Operating Income Ratio Net Profit Ratio Return on Assets Return on Equityarrow_forwardResolve and explain the result of the current ratio for XYZ Company and compare andexplain this result with the Industry average, where current liabilities = $581,000 andcurrent assets = $832,000. a. Resolve the current ratio for XYZ Company b.Explain the result of the current ratio for XYZ Company c.Compare and explain the result of the current ratio for XYZ Company with the Industryaverage.arrow_forward
- Consider the following company’s balance sheet and income statement. For this company, calculate the following: Current ratio. Number of days’ sales in receivables. Sales to total assets.arrow_forwardSelect the Income Statements and Balance Sheets of Aramco Saudi from the calculate the following financial ratios: a. Long-term debt ratios b. Total debt ratio c. Times interest earned d. Cash coverage ration e. current ratio f. Quick ratio g. Operating profit margin h. Inventory Turnover i. Days in inventory j. Average collection period k. Return on equity I. Return on assets m. Payout rationsarrow_forward- Please refer to the following Income Statement and Balance Sheet (see attached picture): Prepare a vertical analysis for both the income statement and balance sheet. Write a paragraph comparing the company’s performance with the industry average. Compute the following ratios and comment on what the results mean when evaluating the company: Current ratio Gross profit percentage ratio Debt ratio Profit margin ratioarrow_forward
- 1. Provide the equation for each ratio listed. 2. What does each ratio listed tell you about the company? 3. Compare the company ratios to the standard ratios, and give an overall analysis of the company.arrow_forwarda)Please calculate all the ratios of companies - Profitability ratios(Profit margin, Return on assets , Return on equity) , Asset utilization ratios (Receivables turnover, Average collection period, Inventory turnover, Fixed asset turnover, Total asset turnover) Liquidity ratios (Current ratio, Quick ratio) & Debt utilization ratios (Debt total assets, Times interest earned, Fixed charge coverage) b) Calculate all your ratios in and Excel File. You need to show all your calculations in excel file but use the calculated value in your main report. c) Discuss each of the ratios for two years and explain their implications for the company. Analyze the ratios that you have calculated d) Use graphs, charts in your analysis.arrow_forwardAlex is currently considering to invest his money in one of the companies betweenCompany A and Company B. The summarized final accounts of the companies for theirlast completed financial year are as follows : (please check the images) a. Calculate the following ratios for Company A and Company B. State clearly theformulae used for each ratio:i. Gross Profit Marginii. Net Profit Marginiii. Inventory Turnover Period (days) + Comment on each of the ratios calculated in part (a) above.arrow_forward
arrow_back_ios
SEE MORE QUESTIONS
arrow_forward_ios
Recommended textbooks for you
 Century 21 Accounting Multicolumn JournalAccountingISBN:9781337679503Author:GilbertsonPublisher:Cengage
Century 21 Accounting Multicolumn Journal
Accounting
ISBN:9781337679503
Author:Gilbertson
Publisher:Cengage
The KEY to Understanding Financial Statements; Author: Accounting Stuff;https://www.youtube.com/watch?v=_F6a0ddbjtI;License: Standard Youtube License