Concept explainers
Refer to the data given in the previous exercise.
c. Are there any outliers in the inflation-adjusted gross movie income data? If so, which data values are outliers?
d. Construct a boxplot for the inflation-adjusted gross movie income data.
e. For the inflation-adjusted gross movie income data, the
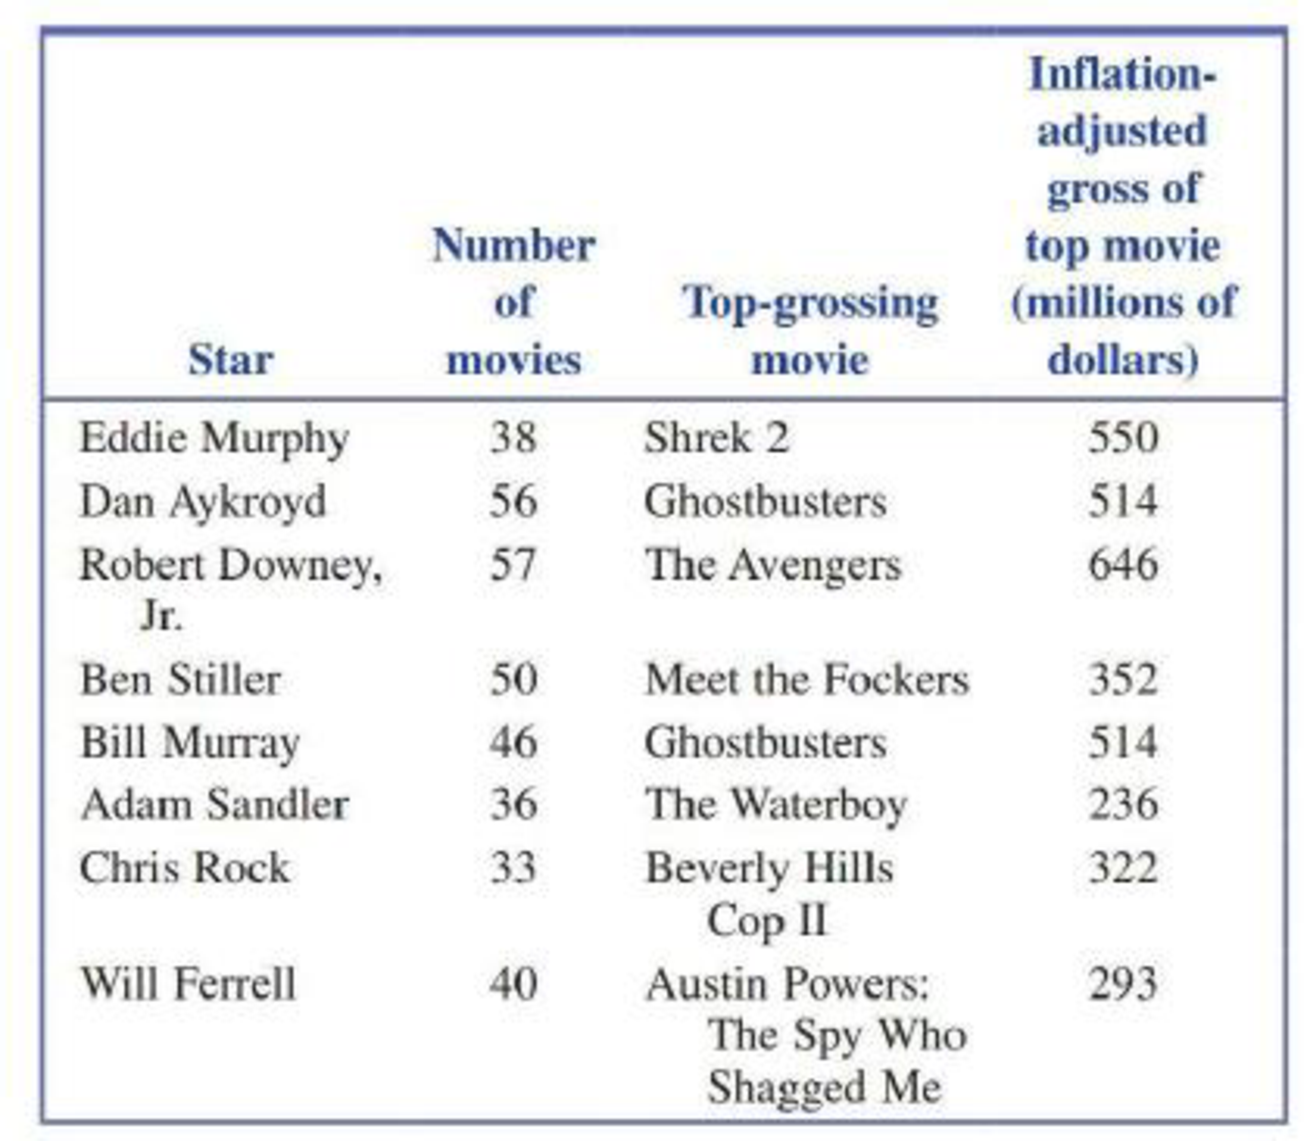
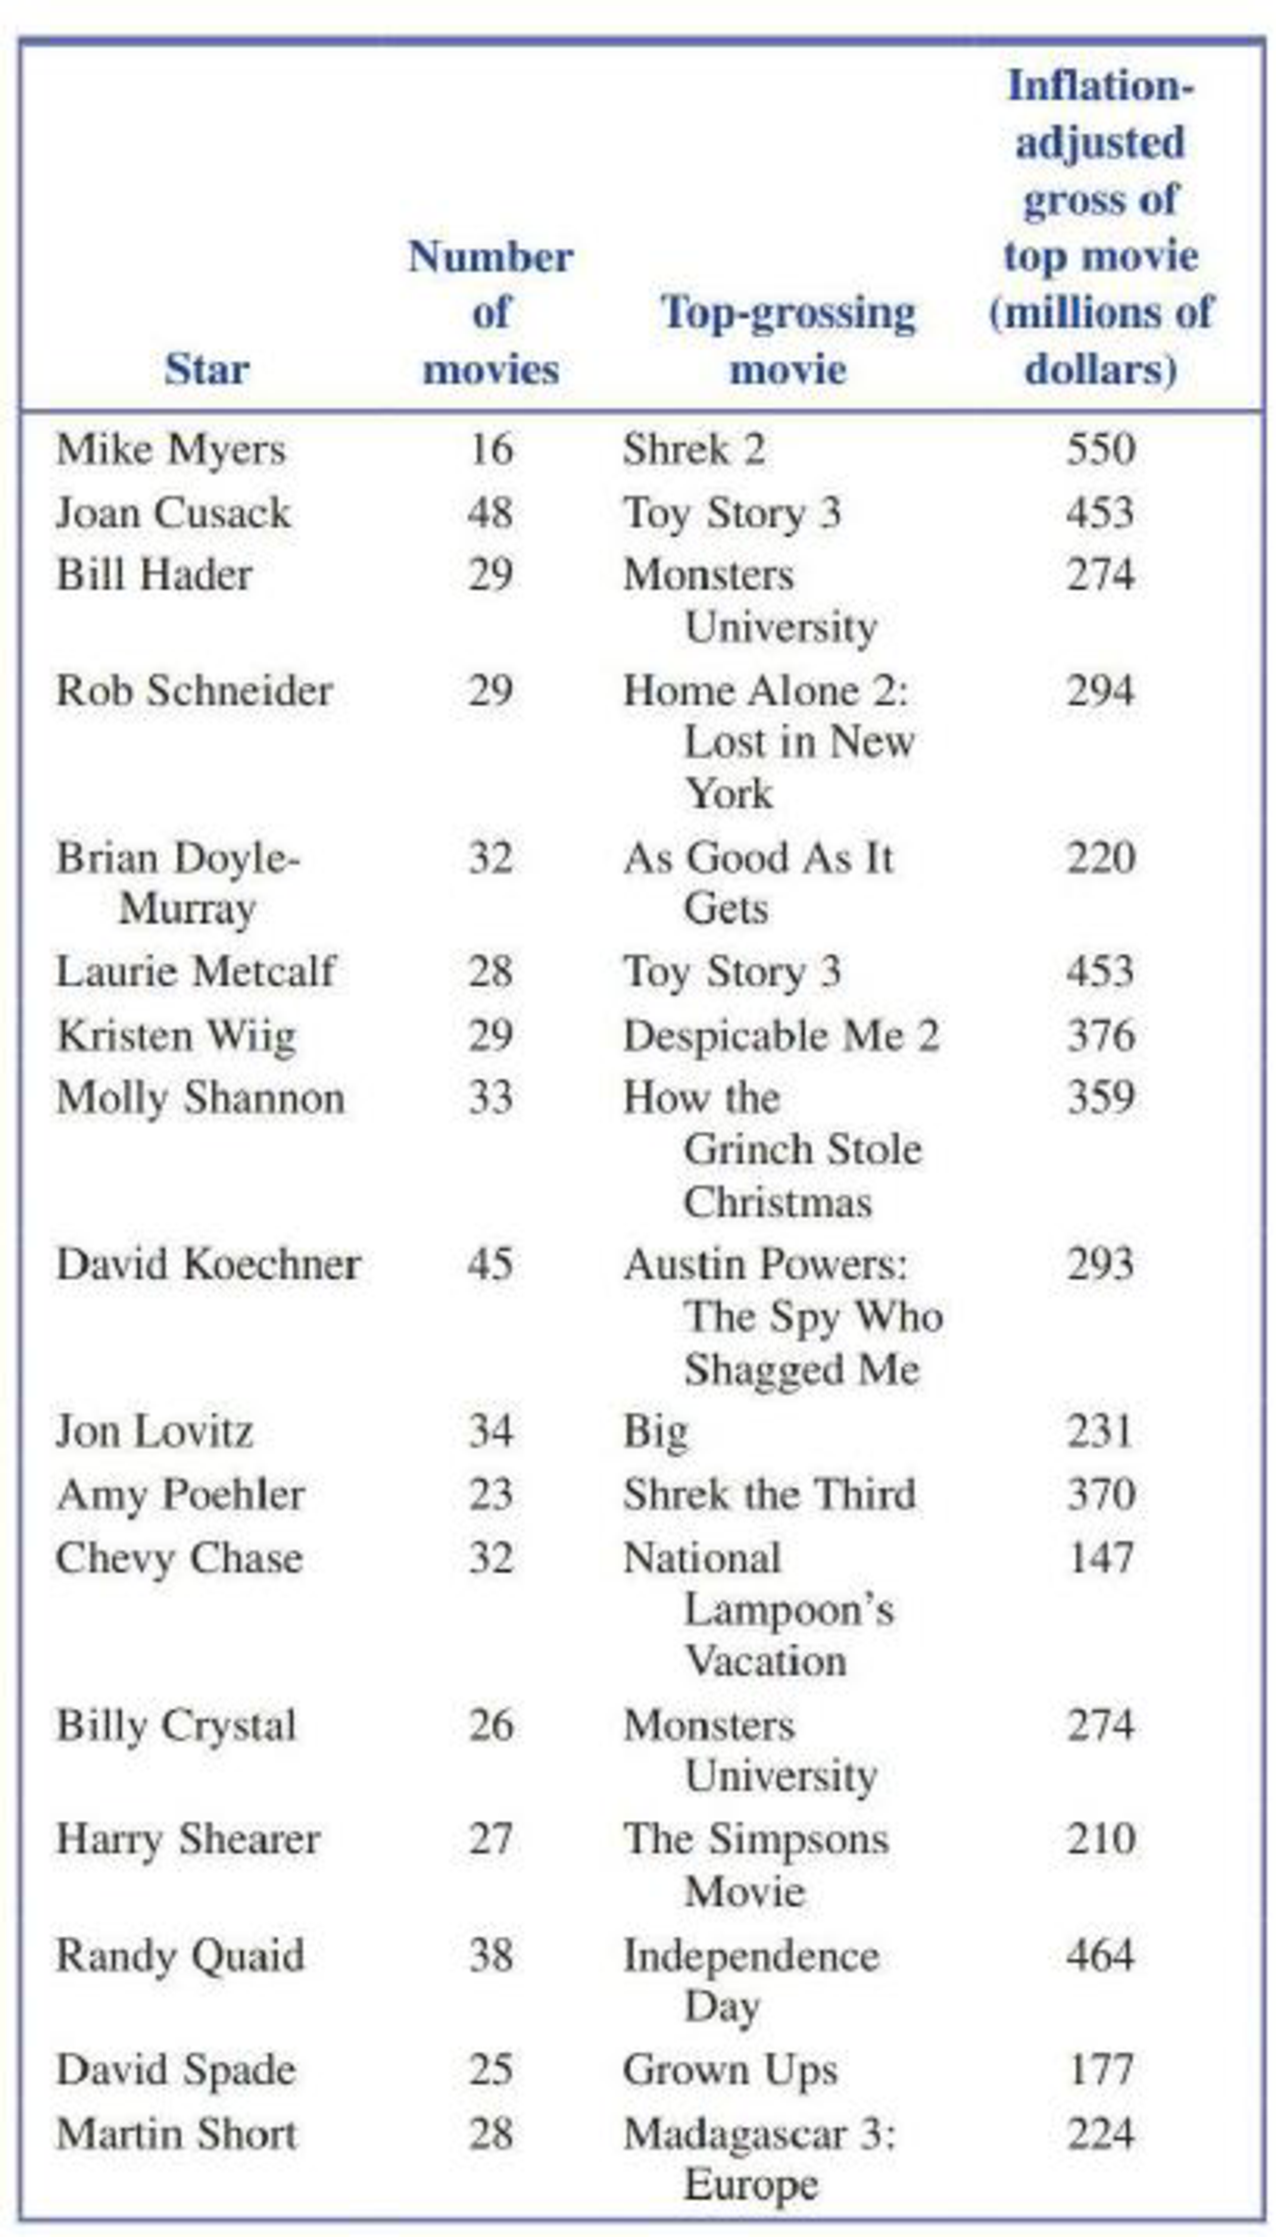
4.67 The Bloomberg web site included the data in the accompanying table on the number of movies made by 25 Saturday Night Live cast members as of 2014 (bloomberg.com/graphics/best-and-worst/#top-grossing-saturday-night-live-alumni, retrieved April 20, 2017). Also given was the top grossing movie made by each and the gross income for that movie adjusted for inflation.


Construct a boxplot for the number of movies data and comment on what the boxplot tells you about the distribution of the number of movies data.
Want to see the full answer?
Check out a sample textbook solution
Chapter 4 Solutions
Introduction To Statistics And Data Analysis
Additional Math Textbook Solutions
Developmental Mathematics (9th Edition)
Fundamentals of Statistics (5th Edition)
Statistics for Engineers and Scientists
Elementary Statistics ( 3rd International Edition ) Isbn:9781260092561
Elementary Statistics Using the TI-83/84 Plus Calculator, Books a la Carte Edition (4th Edition)
 Glencoe Algebra 1, Student Edition, 9780079039897...AlgebraISBN:9780079039897Author:CarterPublisher:McGraw Hill
 Holt Mcdougal Larson Pre-algebra: Student Edition...AlgebraISBN:9780547587776Author:HOLT MCDOUGALPublisher:HOLT MCDOUGAL
 Big Ideas Math A Bridge To Success Algebra 1: Stu...AlgebraISBN:9781680331141Author:HOUGHTON MIFFLIN HARCOURTPublisher:Houghton Mifflin Harcourt


