
Statistics: The Art and Science of Learning from Data (4th Edition)
4th Edition
ISBN: 9780321997838
Author: Alan Agresti, Christine A. Franklin, Bernhard Klingenberg
Publisher: PEARSON
expand_more
expand_more
format_list_bulleted
Concept explainers
Videos
Textbook Question
Chapter 4, Problem 59CP
NCAA men’s basketball poll The last four teams of the Southeast region of the 2011 NCAA Men’s Basketball Tournament were Butler (located in Indiana), Brigham Young University (located in Utah), Florida, and Wisconsin. The sports website ESPN.com asked visitors of the site which team would win the Southeast region. Nationwide results are depicted on the map that follows. It was reported that 44% of the more than 3300 Indiana resident respondents believed Butler would win the regional, and 78% of the more than 5600 Wisconsin resident respondents believed Wisconsin would win.
- a. What are the estimated margins of error associated with the Indiana and Wisconsin polls?
- b. Explain why the percentages within Indiana and Wisconsin vary so drastically from the nationwide percentages displayed in the figure.
- c. It was reported that between 42.3% and 45.7% of Indiana residents believed Butler was likely to win. What type of potential bias prevented these results from being representative of the entire population of Indiana residents?
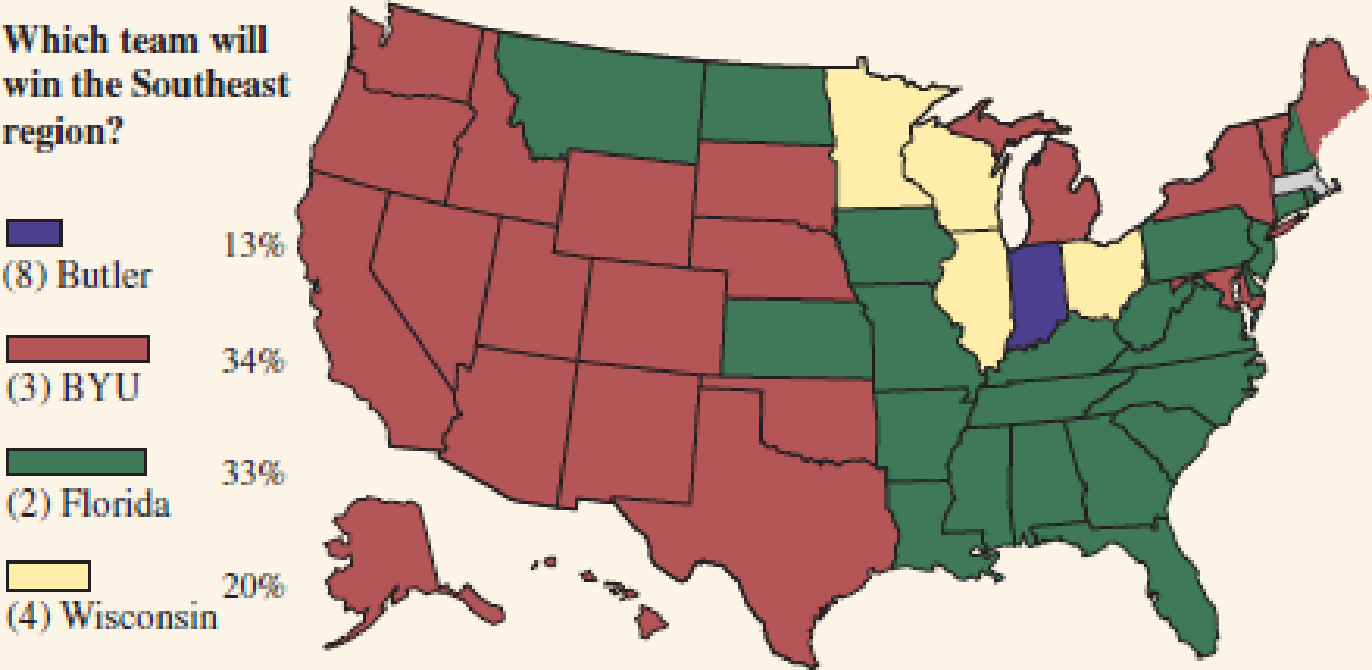
© ESPN.com (2012). Graphic feature used with permission.
Expert Solution & Answer
Want to see the full answer?
Check out a sample textbook solution
Students have asked these similar questions
Sample opticalDens lot run westernBlot
1
1.053 A A
1.708 A A
2.99
0.977 A A
1.67
4
0.881 AB
1.47
0.788 A B
2.25
6
0.788 A B
0.15
7
0.896 AC
1.41
1.038 AC
2.51
9
0.963 AC
1.85
10
0.971 A D
1.7
11
1.234 AD
1.49
12
1.089 A D
1.92
13
0.984 A E
0.96
14
0.986 A E
1.64
15
1.067 A E
16
0.996 BA
1.77
17
1.129 BA
1.69
18
1.016 BA
3.01
19
1.019 B B
1.03
20
1.088 B B
1.94
21
1.28 BB
2.1
22
1.12 BC
0.83
23
1.054 BC
2.52
24
1.235 BC
1.78
1.327 BD
2.2
26
1.361 BD
2.08
27
1.233 BD
1.84
1.079 BE
0.9
29
1.12 B
1.29
30
0.959 BE
1.79
31
1.229 CA
1.46
32
1.027 CA
1.97
33
1.109 CA
2.29
34
1.118 CB
35
1.066 CB
2.06
36
1.146 CB
1.51
37
1.053 CC
1.47
38
1.082 CC
2.19
39
1.113 CC
2
40
1.14 CD
1.7
41
1.172 CD
2.87
0.966 CD
0.3
43
0.963 CE
2.18
44
1.064 CE
1.65
45
1.086 CE
2.59
46
0.985 DA
1.96
47
0.894 DA
2.43
48
1.109 DA
1.56
49
0.847 D B
1.51
50
0.799 DB
1.3
51
0.918 DB
0.7
52
1.033 DC
2.31
0.943 DC
1.85
54
1.089 DC
0.71
55
0.988 DD
1.12
1.169 D D
1.47
57
1.106 D D
2.9
58
1.308 DE
2.08
1.498 DE
1.94
60
1.271…
Not use ai bhffidjsis88sdjcbdudufuivfu
Could you please help me with it. Thank you!
Chapter 4 Solutions
Statistics: The Art and Science of Learning from Data (4th Edition)
Ch. 4.1 - Cell phones Consider the cell phone Study 3...Ch. 4.1 - High blood pressure and binge drinking Many...Ch. 4.1 - Low-fat versus low-carb diet? One hundred...Ch. 4.1 - Experiments versus observational studies When...Ch. 4.1 - School testing for drugs Example 3 discussed a...Ch. 4.1 - Hormone therapy and heart disease Since 1976 the...Ch. 4.1 - Speaking foreign languages A 2014 study...Ch. 4.1 - Breast-cancer screening A study published in 2010...Ch. 4.1 - Experiment or observe? Explain whether an...Ch. 4.1 - Baseball under a full moon During a baseball game...
Ch. 4.1 - Seat belt anecdote Andy once heard about a car...Ch. 4.1 - Poker as a profession? Tonys mother is extremely...Ch. 4.1 - Whats more to blame for obesity? In a study...Ch. 4.1 - Census every 10 years? A nationwide census is...Ch. 4.2 - Choosing officers A campus club consists of five...Ch. 4.2 - Simple random sample of students In Example 4, a...Ch. 4.2 - Auditing accountsapp Use an app or computer...Ch. 4.2 - Sampling from a directory A local telephone...Ch. 4.2 - Bias due to perceived race A political scientist...Ch. 4.2 - Confederates Some southern states in the United...Ch. 4.2 - Instructor ratings The website...Ch. 4.2 - Job trends The 20132014 Recruiting Trends report,...Ch. 4.2 - Gun control More than 75% of Americans answer yes...Ch. 4.2 - Violent video games and family closeness A recent...Ch. 4.2 - Fracking The journal Energy Policy (2014, 65:...Ch. 4.2 - Teens buying alcohol over Internet In August 2006,...Ch. 4.2 - Cheating spouses and bias In a survey conducted by...Ch. 4.2 - Online dating A story titled Personals, Sex Sites...Ch. 4.2 - Identify the bias A newspaper designs a survey to...Ch. 4.2 - Types of bias Give an example of a survey that...Ch. 4.3 - Smoking affects lung cancer? You would like to...Ch. 4.3 - Never leave home without duct tape There have been...Ch. 4.3 - More duct tape In a follow-up study, 103 patients...Ch. 4.3 - Vitamin B A New York Times article (March 13,...Ch. 4.3 - Facebook study During the one-week period of...Ch. 4.3 - Science faculty selection of grad students In an...Ch. 4.3 - Pain reduction medication Consider an experiment...Ch. 4.3 - Pain reduction medication, continued Consider the...Ch. 4.3 - Pain reduction medication, yet again Revisit the...Ch. 4.3 - Colds and vitamin C For some time there has been...Ch. 4.3 - Reducing high blood pressure A pharmaceutical...Ch. 4.4 - Student loan debt A researcher wants to compare...Ch. 4.4 - Club officers again In Exercise 4.15, two officers...Ch. 4.4 - Security awareness training Of 400 employees at a...Ch. 4.4 - Prob. 45PBCh. 4.4 - Prob. 46PBCh. 4.4 - Prob. 47PBCh. 4.4 - Prob. 48PBCh. 4.4 - Prob. 49PBCh. 4.4 - Prob. 50PBCh. 4.4 - Prob. 51PBCh. 4.4 - Prob. 52PBCh. 4.4 - Effect of partner smoking in smoking cessation...Ch. 4 - Cell phones If you want to conduct a study with...Ch. 4 - Observational versus experimental study Without...Ch. 4 - Unethical experimentation Give an example of a...Ch. 4 - Spinal fluid proteins and Alzheimers A research...Ch. 4 - Fear of asbestos Your friend reads about a study...Ch. 4 - NCAA mens basketball poll The last four teams of...Ch. 4 - Sampling your fellow students You are assigned to...Ch. 4 - Prob. 61CPCh. 4 - Comparing female and male students You plan to...Ch. 4 - Football discipline A large southern university...Ch. 4 - Prob. 64CPCh. 4 - Voluntary sports polls In 2014, the Pittsburgh...Ch. 4 - Video games mindless? Playing video games not so...Ch. 4 - Physicians health study Read about the first...Ch. 4 - Aspirin prevents heart attacks? During the 1980s...Ch. 4 - Prob. 69CPCh. 4 - Prob. 70CPCh. 4 - Prob. 71CPCh. 4 - Bupropion and nicotine patch study results The...Ch. 4 - Prefer Coke or Pepsi? You want to conduct an...Ch. 4 - Prob. 74CPCh. 4 - Samples not equally likely in a cluster sample? In...Ch. 4 - Nursing homes You plan to sample residents of...Ch. 4 - Multistage health survey A researcher wants to...Ch. 4 - Hazing Hazing within college fraternities is a...Ch. 4 - Prob. 79CPCh. 4 - Twins and breast cancer Excessive cumulative...Ch. 4 - Judging sampling design In each of the following...Ch. 4 - Prob. 87CPCh. 4 - Age for legal alcohol You want to investigate the...Ch. 4 - Prob. 89CPCh. 4 - Prob. 90CPCh. 4 - Issues in clinical trials A randomized clinical...Ch. 4 - Prob. 92CPCh. 4 - Prob. 93CPCh. 4 - Prob. 94CPCh. 4 - Prob. 95CPCh. 4 - Prob. 96CPCh. 4 - For Exercises 4.974.103, select the best response....Ch. 4 - Prob. 98CPCh. 4 - For Exercises 4.974.103, select the best response....Ch. 4 - For Exercises 4.974.103, select the best response....Ch. 4 - Prob. 101CPCh. 4 - For Exercises 4.974.103, select the best response....Ch. 4 - Prob. 103CPCh. 4 - Systematic sampling A researcher wants to select...Ch. 4 - Prob. 106CPCh. 4 - Prob. 107CP
Knowledge Booster


Learn more about
Need a deep-dive on the concept behind this application? Look no further. Learn more about this topic, statistics and related others by exploring similar questions and additional content below.Similar questions
- Please help me with this. Thank you!arrow_forwardConstruct a frequency distribution for the given data set using 6 classes. In the table, include the midpoints, relative frequencies, and cumulative frequencies. Which class has the greatest frequency and which has the least frequency? Question Viewer Amount (in dollars) spent on books for a semester 422 106 355 400 381 411 106 50 62 511 394 54 381 505 437 359 267 311 268 115 407 413 192 252 80 454 107 330 486 Complete the table, starting with the lowest class limit. Use the minimum data entry as the lower limit of the first class. (Type integers or decimals. Round the class limits to the nearest whole number. Round all other values to the nearest thousandth as needed.) Class 50-126 Frequency 9 Midpoint 88 Relative Frequency Cumulative Frequency 0.333 9arrow_forwardTo assure 99% confidence another poll is conducted, again asking whether or nothuman cloning should be allowed. 5,000 randomly selected adults from across thenation are surveyed. Of those surveyed 4,388 respond that they are against humancloning. Construct a 99% confidence interval estimate for the proportion of adults whoare against human cloning. Does this interval support the newspaper’s claim?arrow_forward
- Could you help me please. Thank you!arrow_forwardCan you help me with it please.arrow_forwardIn a recent national poll consisting of 1012 randomly selected adults. Participants wereasked whether or not human cloning should be allowed. Of those surveyed 900indicated human cloning should not be allowed. A newspaper releases and articleclaiming 90% of those across the nation are against human cloning based on thenational poll. Construct a 95% confidence interval estimate for the proportion of adultswho are against human cloning. Does this interval support the newspaper’s claim? What sample size would be needed to assure 99% confidence with an error bound of 0.02?arrow_forward
- In a recent national poll consisting of 1012 randomly selected adults. Participants wereasked whether or not human cloning should be allowed. Of those surveyed 900indicated human cloning should not be allowed. A newspaper releases and articleclaiming 90% of those across the nation are against human cloning based on thenational poll. Construct a 95% confidence interval estimate for the proportion of adultswho are against human cloning. Does this interval support the newspaper’s claim?arrow_forwardIt is known that 30% of all households still have landlines. If we randomly select 10 households, let X = number that have landlines a) FInd the probability that X = 3. b) Find the mean and standard deviation of X.arrow_forwardplease answer and show workarrow_forward
- Please answer and show workarrow_forwardplease answer and show workarrow_forwardSuppose you want to have $300,000 for retirement in 25 years. Your account earns 8% interest. a) How much would you need to deposit in the account each month? SA $ b) How much interest will you earn? $1 Message instructor Enter an integer or decimal number [more..] Question Help: Video Submit Question esc ! 1 F1 F2 80 F3 # $ 2 3 4 Ơ ☑ F4 F5 % <6 olo 50 F6 A F7 Q W E R T Y ab A lock Z S X D C 7 LL F G Harrow_forward
arrow_back_ios
SEE MORE QUESTIONS
arrow_forward_ios
Recommended textbooks for you
 Glencoe Algebra 1, Student Edition, 9780079039897...AlgebraISBN:9780079039897Author:CarterPublisher:McGraw Hill
 Holt Mcdougal Larson Pre-algebra: Student Edition...AlgebraISBN:9780547587776Author:HOLT MCDOUGALPublisher:HOLT MCDOUGAL
 Big Ideas Math A Bridge To Success Algebra 1: Stu...AlgebraISBN:9781680331141Author:HOUGHTON MIFFLIN HARCOURTPublisher:Houghton Mifflin Harcourt
Glencoe Algebra 1, Student Edition, 9780079039897...
Algebra
ISBN:9780079039897
Author:Carter
Publisher:McGraw Hill
Holt Mcdougal Larson Pre-algebra: Student Edition...
Algebra
ISBN:9780547587776
Author:HOLT MCDOUGAL
Publisher:HOLT MCDOUGAL
Big Ideas Math A Bridge To Success Algebra 1: Stu...
Algebra
ISBN:9781680331141
Author:HOUGHTON MIFFLIN HARCOURT
Publisher:Houghton Mifflin Harcourt
Bayes' Theorem 1: Introduction and conditional probability; Author: Dr Nic's Maths and Stats;https://www.youtube.com/watch?v=lQVkXfJ-rpU;License: Standard YouTube License, CC-BY
What is Conditional Probability | Bayes Theorem | Conditional Probability Examples & Problems; Author: ACADGILD;https://www.youtube.com/watch?v=MxOny_1y2Q4;License: Standard YouTube License, CC-BY
Bayes' Theorem of Probability With Tree Diagrams & Venn Diagrams; Author: The Organic Chemistry Tutor;https://www.youtube.com/watch?v=OByl4RJxnKA;License: Standard YouTube License, CC-BY
Bayes' Theorem - The Simplest Case; Author: Dr. Trefor Bazett;https://www.youtube.com/watch?v=XQoLVl31ZfQ;License: Standard Youtube License