
Survey of Accounting (Accounting I)
8th Edition
ISBN: 9781305961883
Author: Carl Warren
Publisher: Cengage Learning
expand_more
expand_more
format_list_bulleted
Videos
Textbook Question
Chapter 4, Problem 4.7.3MBA
Gross profit percent and markup percent
Deere & Company (DE) produces and sells tractors, loaders, combines, lawnmowers, and a variety of other equipment. The following data (in millions) were adapted from recent financial statements of Deere.
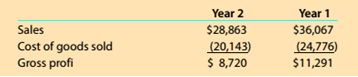
Compare the results in parts (1) and (2) for ‘tears 1 and 2. Comment on your comparison.
Expert Solution & Answer
Want to see the full answer?
Check out a sample textbook solution
Students have asked these similar questions
How does operational efficiency measurement differ from financial metrics? a) Process effectiveness indicators complement cost measures b) Financial data tells complete story c) Efficiency remains constant d) Standard metrics work everywhere. Please tutor give me answer to this general accounting Question
Need answer
WHAT IS THE ANSWER?
Chapter 4 Solutions
Survey of Accounting (Accounting I)
Ch. 4 - If merchandise purchased on account is returned,...Ch. 4 - Prob. 2SEQCh. 4 - Prob. 3SEQCh. 4 - On a multiple-step income statement, the excess of...Ch. 4 - As of December 31, 20Y4, Ames Corporation's...Ch. 4 - What distinguishes a retail business from a...Ch. 4 - Prob. 2CDQCh. 4 - Prob. 3CDQCh. 4 - Prob. 4CDQCh. 4 - Prob. 5CDQ
Ch. 4 - When you purchase a new car, the “sticker price”...Ch. 4 - Prob. 7CDQCh. 4 - Differentiate between the multiple and single-step...Ch. 4 - Prob. 9CDQCh. 4 - Can a business earn a gross profit but incur a net...Ch. 4 - Prob. 11CDQCh. 4 - Prob. 12CDQCh. 4 - Determining gross profit During the current year,...Ch. 4 - Determining cost of goods sold For a recent year,...Ch. 4 - Purchase-related transaction Burr Company...Ch. 4 - Purchase-related transactions A retailer Is...Ch. 4 - Prob. 4.5ECh. 4 - Prob. 4.6ECh. 4 - Determining amounts to be paid on invoices...Ch. 4 - Prob. 4.8ECh. 4 - Sales-related transactions After the amount due on...Ch. 4 - Sales-related transactions Merchandise is sold on...Ch. 4 - Prob. 4.11ECh. 4 - Prob. 4.12ECh. 4 - Prob. 4.13ECh. 4 - Prob. 4.14ECh. 4 - Adjustment for merchandise inventory shrinkage...Ch. 4 - Adjustment for Customer Refunds and Returns Assume...Ch. 4 - Prob. 4.17ECh. 4 - Multiple-step income statement On March 31, 20Y5,...Ch. 4 - Single-step income statement Summary operating...Ch. 4 - Multiple-step income statement Identify the enurs...Ch. 4 - Purchase-related transactions The following...Ch. 4 - Sales-related transactions The- following selected...Ch. 4 - Prob. 4.3PCh. 4 - Multiple-step income statement and report form of...Ch. 4 - Multiple-step income statement and report form of...Ch. 4 - Multiple-step income statement and report form of...Ch. 4 - Multiple-step income statement and report form of...Ch. 4 - Single-step income statement Selected accounts and...Ch. 4 - Prob. 4.5.2PCh. 4 - Prob. 4.6.1PCh. 4 - Prob. 4.6.2PCh. 4 - Prob. 4.1MBACh. 4 - Sales transactions Using transactions listed in...Ch. 4 - Prob. 4.3MBACh. 4 - Prob. 4.4MBACh. 4 - Prob. 4.5.1MBACh. 4 - Gross margin percent and markup percent Target...Ch. 4 - Gross margin percent and markup percent Target...Ch. 4 - Prob. 4.6MBACh. 4 - Gross profit percent and markup percent Deere &...Ch. 4 - Prob. 4.7.2MBACh. 4 - Gross profit percent and markup percent Deere &...Ch. 4 - Gross profit percent and markup percent...Ch. 4 - Gross profit percent and markup percent...Ch. 4 - Gross profit percent and markup percent...Ch. 4 - Prob. 4.9MBACh. 4 - Prob. 4.10.1MBACh. 4 - Gross profit percent and markup percent Companies...Ch. 4 - Prob. 4.10.3MBACh. 4 - Prob. 4.1CCh. 4 - Prob. 4.2CCh. 4 - Prob. 4.3.1CCh. 4 - Determining cost of purchase The following is an...Ch. 4 - Prob. 4.4.1CCh. 4 - Prob. 4.4.2CCh. 4 - Prob. 4.4.3CCh. 4 - Prob. 4.5C
Knowledge Booster


Learn more about
Need a deep-dive on the concept behind this application? Look no further. Learn more about this topic, accounting and related others by exploring similar questions and additional content below.Similar questions
- 25.arrow_forwardAnswer this financial accounting problemarrow_forwardDuring FY 2022 Munjya Manufacturing had total manufacturing costs are $408,000. Their cost of goods manufactured for the year was $431,000. The January 1, 2023 balance of the Work-in-Process Inventory is $42,000. Use this information to determine the dollar amount of the FY 2022 beginning Work-in-Process Inventory.arrow_forward
- Question 5 Marks: BigBoss Inc. provides the following extracts from income statement for the year 2009: Net sales $500,000, Cost of Goods Sold (150,000), Gross profit $350,000, Calculate the gross profit percentage.arrow_forwardThe ROA for 2020 was?arrow_forwardPROVIDE ANSWER: On June 30, 2009, Straight Movers had $243,000 in current assets and $211,000 in current liabilities. On August 1, 2009, Straight received $50,000 from an issue of promissory notes that will mature in 2012. The notes pay interest on February 1 at an annual rate of 6 percent. Straights' fiscal year ends on December 31. What is the interest expense for December 31?arrow_forward
arrow_back_ios
SEE MORE QUESTIONS
arrow_forward_ios
Recommended textbooks for you
 Managerial Accounting: The Cornerstone of Busines...AccountingISBN:9781337115773Author:Maryanne M. Mowen, Don R. Hansen, Dan L. HeitgerPublisher:Cengage Learning
 Survey of Accounting (Accounting I)AccountingISBN:9781305961883Author:Carl WarrenPublisher:Cengage Learning
 Managerial AccountingAccountingISBN:9781337912020Author:Carl Warren, Ph.d. Cma William B. TaylerPublisher:South-Western College Pub
 College Accounting, Chapters 1-27AccountingISBN:9781337794756Author:HEINTZ, James A.Publisher:Cengage Learning,
 College Accounting, Chapters 1-27 (New in Account...AccountingISBN:9781305666160Author:James A. Heintz, Robert W. ParryPublisher:Cengage Learning
Managerial Accounting: The Cornerstone of Busines...
Accounting
ISBN:9781337115773
Author:Maryanne M. Mowen, Don R. Hansen, Dan L. Heitger
Publisher:Cengage Learning
Survey of Accounting (Accounting I)
Accounting
ISBN:9781305961883
Author:Carl Warren
Publisher:Cengage Learning
Managerial Accounting
Accounting
ISBN:9781337912020
Author:Carl Warren, Ph.d. Cma William B. Tayler
Publisher:South-Western College Pub
College Accounting, Chapters 1-27
Accounting
ISBN:9781337794756
Author:HEINTZ, James A.
Publisher:Cengage Learning,
College Accounting, Chapters 1-27 (New in Account...
Accounting
ISBN:9781305666160
Author:James A. Heintz, Robert W. Parry
Publisher:Cengage Learning
Markup and Markdown; Author: GreggU;https://www.youtube.com/watch?v=EFtodgI46UM;License: Standard Youtube License